Template API Reference
- class mpl_template.template.Template(margins: Tuple[int, int, int, int] | None = None, titleblock_content=None, titleblock_cols=None, titleblock_rows=None, scriptname=None, draft=True, base=None, dpi: float = 300, **figkwargs)[source]
Class to construct a report figure template using matplotlib which includes a figure border, script path, and title block.
- Parameters:
scriptname (str) – Path to the script or notebook that is creating the figure.
margins (tuple of int, optional (default = (4, 4, 4, 4)) – A length-4 tuple specifying the left, right, top, and bottom margins of on the page, respectively
titleblock_content (list of dicts, optional) –
Title block elements where each element is itself a dictionary with a span keys that determines which rows and columns the each element will occupy in the titleblock. E.g.
tbk = [
    {
        'name': 'Title',

        #`text` must be a dict or a list of dicts
        'text': [
            {
                's': 'Figure Title',
                'weight': 'bold',
            },
            {
                's': 'Figure Subtitle',
                'weight': 'light',
            },
        ],

        #`image` must refer to dict with `path` key (required),
        # and optional keys `scale` and `expand` which default
        # to 1 and False, respectively.
        'image': {
            'path': 'img//logo.png',
            'scale': 1,
            'axes': {
                # these are passed to the figure.add_axes() as kwargs
                # and applied to the axes of the image, not the outer
                # frame element.
                'zorder': 110,
            }
        },

        #`span` must be a list of integers for the
        # gridspec columns that the titleblock element will
        # span in tenths of an inch. The following span
        # will give a titleblock element that is 0.8 inches tall
        # and 3.2 inches wide. It will be the top left element
        # of the block because its height and width begin at zero.
        'span': [0, 8, 0, 32],
        'axes': {
            # these are passed to the figure.add_axes() as kwargs
            # and applied to the titleblock frame element
            'facecolor': 'white',
        }
    },
    {   # specify keys for next tbk element
    },
]
titleblock_cols (tuple of int, optional (default=(16, 16, 8))) – The specification (in tenths of an inch) of the rulers for each column in the title block.
titleblock_rows (tuple of int, optional (default=(8, 5, 3))) – The specification (in tenths of an inch) of the rulers for each rows in the title block.
draft (bool, optional (default=True)) – Toggles the inclusion of a draft watermark.
base (int, optional (default=10)) – Number of gridspec rows and columns per inch.
dpi (int, optional (default=300)) – Resolution of the final figure in dots per inch.
**figkwargs – Additional keyword arguments passed to
plt.figure
Examples
To produce an empty figure containing a border object, and 5 title block objects:
>>> from mpl_template import Template
>>> report_fig = Template(figsize=(8.5, 11), scriptname="path/to/script.py")
>>> fig = report_fig.blank()
(
Source code,png,hires.png,pdf)
insert_image API Reference
- mpl_template.template.insert_image(ax: Axes, image_path: str, scale: float = 1.0, dpi: float = 300.0, expand: bool = False, **kwargs) Axes[source]
Centers an image within an axes object
- Parameters:
ax (
matplotlib.Axes) – the axes into which the image should be inserted.image_path (str) – Path to an existing image file.
scale (float, optional) – The relative scale of the desired output. Values should be positive floats. E.g. scale = 2 will double the image’s size relative to the given matplotlib.Axes object. scale = 0.5 will scale the image to half of the given matplotlib.Axes object.
dpi (int, optional (default=300)) – The Dots (pixel) Per Inch of the image.
expand (bool, optional (default=False)) – If true, the image will expand to fill the axes in which it is embedded. Use expand = True if the boundary of the enclosing axes is the desired crop boundary. Use expand = False if the image should be scaled in-place with it’s original aspect ratio. This option only affects images that have been zoomed (scale > 1).
kwargs (keyword arguments to pass to the figure.add_axes()) – constructor.
- Returns:
ax
- Return type:
matplotlib.Axes
Notes
Use scale parameter to zoom image relative to axes boundary.
Examples
Images are inserted centered, scaled, and filling the parent axes object.
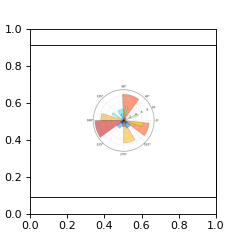
Zoomed out 2x with
scale=0.5. Note that the enclosing axes is square, and that the inserted axes is a landscape rectangle that matches the shape of the source file.>>> import matplotlib.pyplot as plt >>> from mpl_template import insert_image >>> file = "img/polar_bar_demo.png" >>> fig, ax = plt.subplots(figsize=(3, 3)) >>> img_ax = insert_image(ax, file, scale=0.5)
(
Source code,png,hires.png,pdf)
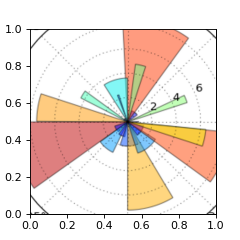
Zoomed in 2x with
scale=2. Note that the use of theexpandkwarg causes the zoomed image to fill the enclosing square axes object.>>> import matplotlib.pyplot as plt >>> from mpl_template import insert_image >>> file = "img/polar_bar_demo.png" >>> fig, ax = plt.subplots(figsize=(3, 3)) >>> img_ax = insert_image(ax, file, scale=2, expand=True)
(
Source code,png,hires.png,pdf)