Walkthrough
The following is a detailed orientation on the Template class and insert_image functions.
[1]:
import copy
import os

import matplotlib.gridspec as gs
import matplotlib.pyplot as plt
import numpy as np

from mpl_template import Template, insert_image

# # make the inline output identical to the PDF.
%config InlineBackend.print_figure_kwargs = {'bbox_inches':None}
[2]:
SCRIPT = "Template_Docs.ipynb"
PATH = os.path.join(os.path.join(*os.getcwd().split(os.sep)[-2:]), SCRIPT)
Basics
The Builtin template layout is revealed with the blank() method of the Template object. This method labels the axes names that make up the default figure axes elements. These elements will contain the title block contents.
[3]:
report_fig = Template(figsize=(8.5, 11), scriptname=SCRIPT)

blank_fig = report_fig.blank()
page = report_fig.add_page()  # This is a helper function that is useful when
# working with %matplotlib inline

Titleblock
The titeleblock boxes are each matplotlib.axes.Axes() instances that have been created with gridspec.GridSpecFromSubplotSpec. The titleblock is stored as a list of dicts, and the widths and heights of the Axes objects are controlled using a list of dicts which contain a 'span' key. For Example:
user_specified = [
    {'span': [0, 5, 0, 10]},
    {'span': [5, 10, 0, 10]},
]
would create two boxes stacked on top of each other, both of them .5 inches tall and 1 inch wide.
User Defined Titleblock
Populating the figure axes objects above is simple with a loop, and a function to perform the logic for each axes element. There is a helper method called populate_titleblock() to assist with this task, or the user may specify their own function for special cases.
titleblock_ = [
    {
        'name': 'string',
        # Optional if box is meant to be empty.
        # Required if box will be populated.
        # The value referenced by the 'name' key is
        # used to assign the 'label' attribute of the
        # Axes instance.

        'text': [{}, {}],
        # Optional if box will not contain text.
        # Dict or list of dicts containing Axes.text()
        # kwargs

        'span': [],
        # Optional if default box dimensions should be used.
        # User input of this attribute overrides the
        # default span widths and heights and may require the
        # user to also adjust the
        # template.Template.gstitleblock() values to create
        # the intended box.

        'image': {
            'path': 'path\to\image.png',
            # Required, may be web address
            # or local file path
            'scale': int or float,
            # Optional, defaults to 1.
            # use scale > 1 for zoom-in
            # and scale < 1 for zoom-out
            'expand': bool,
            # Optional, defaults to False.
            # Applies only if scale > 1.
            # If True, image is expanded to completely
            # fill enclosing axes object.
            # If False, image is zoomed and cropped
            # to original aspect ratio.
            'axes': {},
            # these are passed to the figure.add_axes() as kwargs
            # and applied to the axes with the image, not the outer
            # frame element. E.g,. if the frame has a facecolor set
            # we can ensure the image is in front by setting the
            # zorder of the image here with { 'zorder': 110}

        },
        'axes': {},
        # these are passed to the figure.add_axes() as kwargs
        # and applied to the titleblock frame element.
        # e.g., {'facecolor': 'white', zorder: 100}
    },
    {},      # Box 2
    {},      # Box 3 etc...
]
This example will build a title block as follows using the default spans as shown in the blank() output above.
“b_0” will contain a title and subtitle with different formatting
“b_1” will contain a logo image
“b_2” will contain the project number
“b_3” will contain the date
“b_4” will contain the figure number
[4]:
TBK = [
    {
        "name": "title",
        "text": [
            {
                "s": "Example Figure",
                "weight": "bold",
                "x": 0.5,
                "y": 0.54,
                "va": "baseline",
                "ha": "center",
            },
            {
                "s": "Weyland-Yutani",
                "weight": "light",
                "x": 0.5,
                "y": 0.46,
                "va": "top",
                "ha": "center",
                "color": (0.3, 0.3, 0.3),
            },
        ],
    },
    {
        "name": "logo",
        "image": {
            "path": "img/logo.png",
            "scale": 0.75,
        },
    },
    {
        "name": "project",
        "text": {
            "s": "USCSS $Nostromo$",
            "x": 0.5,
            "y": 0.5,
            "va": "center",
            "ha": "center",
        },
    },
    {
        "name": "date",
        "text": {
            "s": "June 2122",
            "x": 0.5,
            "y": 0.5,
            "va": "center",
            "ha": "center",
        },
    },
    {
        "name": "fignum",
        "text": {
            "s": "Figure\n\n{:02d}",
            "weight": "bold",
            "x": 0.5,
            "y": 0.5,
            "va": "center",
            "ha": "center",
        },
    },
]
[5]:
report_fig = Template(figsize=(8.5, 11), scriptname=SCRIPT, titleblock_content=TBK)
report_fig.path_text = PATH
# typically the path is populated via the required `scriptname` kwarg
# but it can be overwritten with this `path_text` property

report_fig.add_frame()
report_fig.add_titleblock()
report_fig.add_path_text()
report_fig.populate_titleblock()
page = report_fig.add_page()

Below are the Axes objects created by the Template class and TBK variable. Note that frame and img_b_1 were not labeled by the user, but by the Template.
[6]:
for ax in report_fig.fig.get_axes():
    print(ax.get_label())
frame
title
logo
project
date
fignum
img_b_1
page
Under The Hood
The template object works by breaking down the figure into a grid of 0.1” squares and using matplotlib’s GridSpec to define the axes objects that make up the title block boxes and border. This means that the code is extremely flexible for changing things like margins, titleblock width, and inserting multiple axes into compliated layouts. However, this also means that a user must call GridSpec() or GridSpecFromSubplotSpec() in order to populate the figure.
By default, the template will use 10 as the base and create the gridspec with 0.1” increments for the row and column. This makes the ‘unit’s of the row and column index for the spec in ‘integer tenths of an inch’. If higher precision is required, you can use base=100, but all of the subplot specs will then have to use ‘integer hundredths of an inch’.
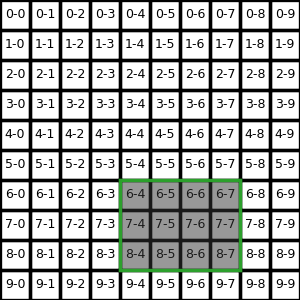
Below is a 1” by 1” example to illustrate the underlying grid of the template.
[7]:
w, h = 1, 1
report_fig = Template(figsize=(w, h), scriptname=SCRIPT, draft=False)

for r in range(h * int(report_fig.base)):
    for c in range(w * int(report_fig.base)):
        ax = report_fig.fig.add_subplot(
            report_fig.gsfig[r : r + 1, c : c + 1],
            facecolor="none",
            xticks=[],
            yticks=[],
        )

        ax.text(0.5, 0.5, f"{r}-{c}", ha="center", va="center", fontsize=3)


# and an example subplot selection that spans multiple
# rows and columns of the grid.
ax = report_fig.fig.add_subplot(
    report_fig.gsfig[6:9, 4:8],
    facecolor=(0.2, 0.2, 0.2, 0.5),
    xticks=[],
    yticks=[],
)
for spine in ax.spines.values():
    spine.set_color("C2")
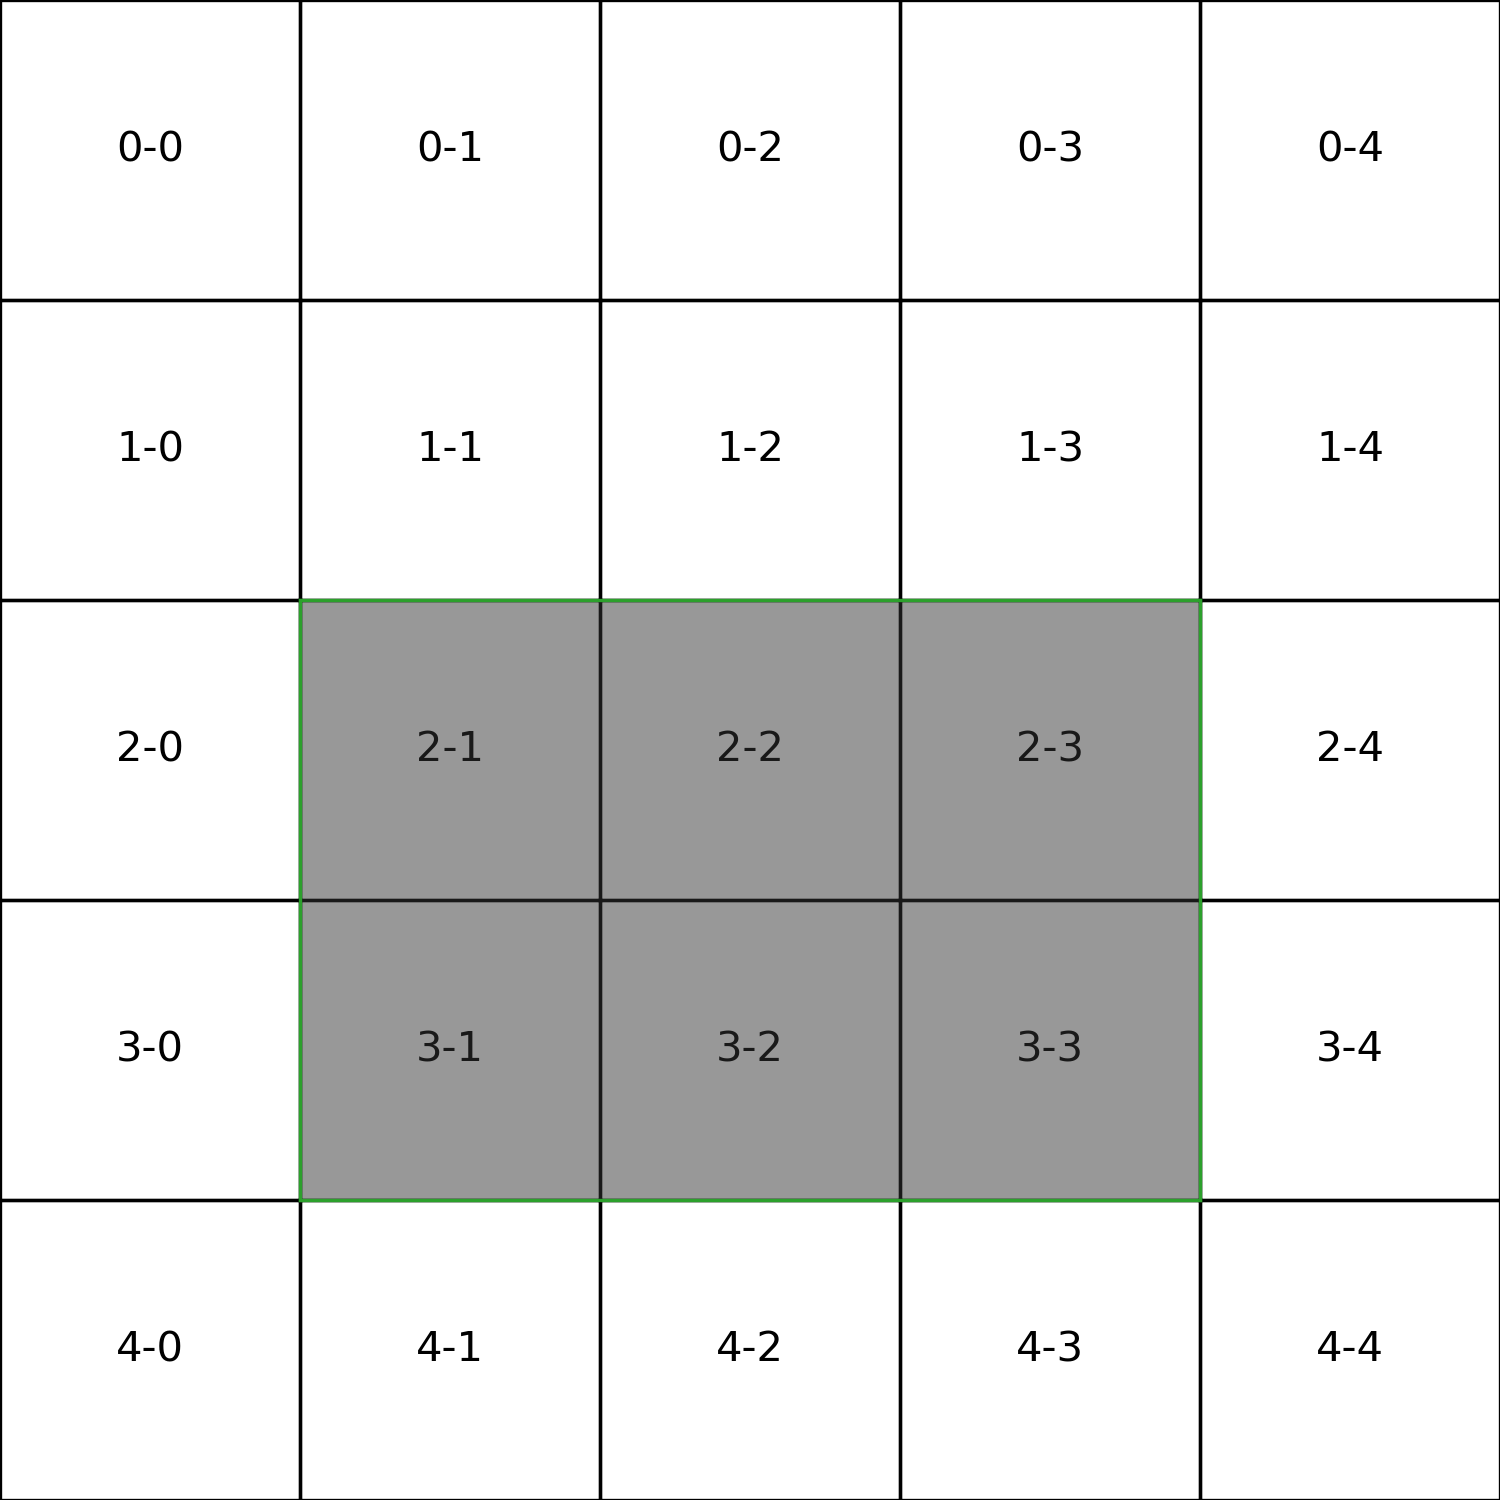
[8]:
w, h = 5, 5
report_fig = Template(figsize=(w, h), scriptname=SCRIPT, draft=False, base=1)

for r in range(h * int(report_fig.base)):
    for c in range(w * int(report_fig.base)):
        ax = report_fig.fig.add_subplot(
            report_fig.gsfig[r : r + 1, c : c + 1],
            facecolor="none",
            xticks=[],
            yticks=[],
        )

        ax.text(0.5, 0.5, f"{r}-{c}", ha="center", va="center")

ax = report_fig.fig.add_subplot(
    report_fig.gsfig[2:4, 1:4],
    facecolor=(0.2, 0.2, 0.2, 0.5),
    xticks=[],
    yticks=[],
)
for spine in ax.spines.values():
    spine.set_color("C2")
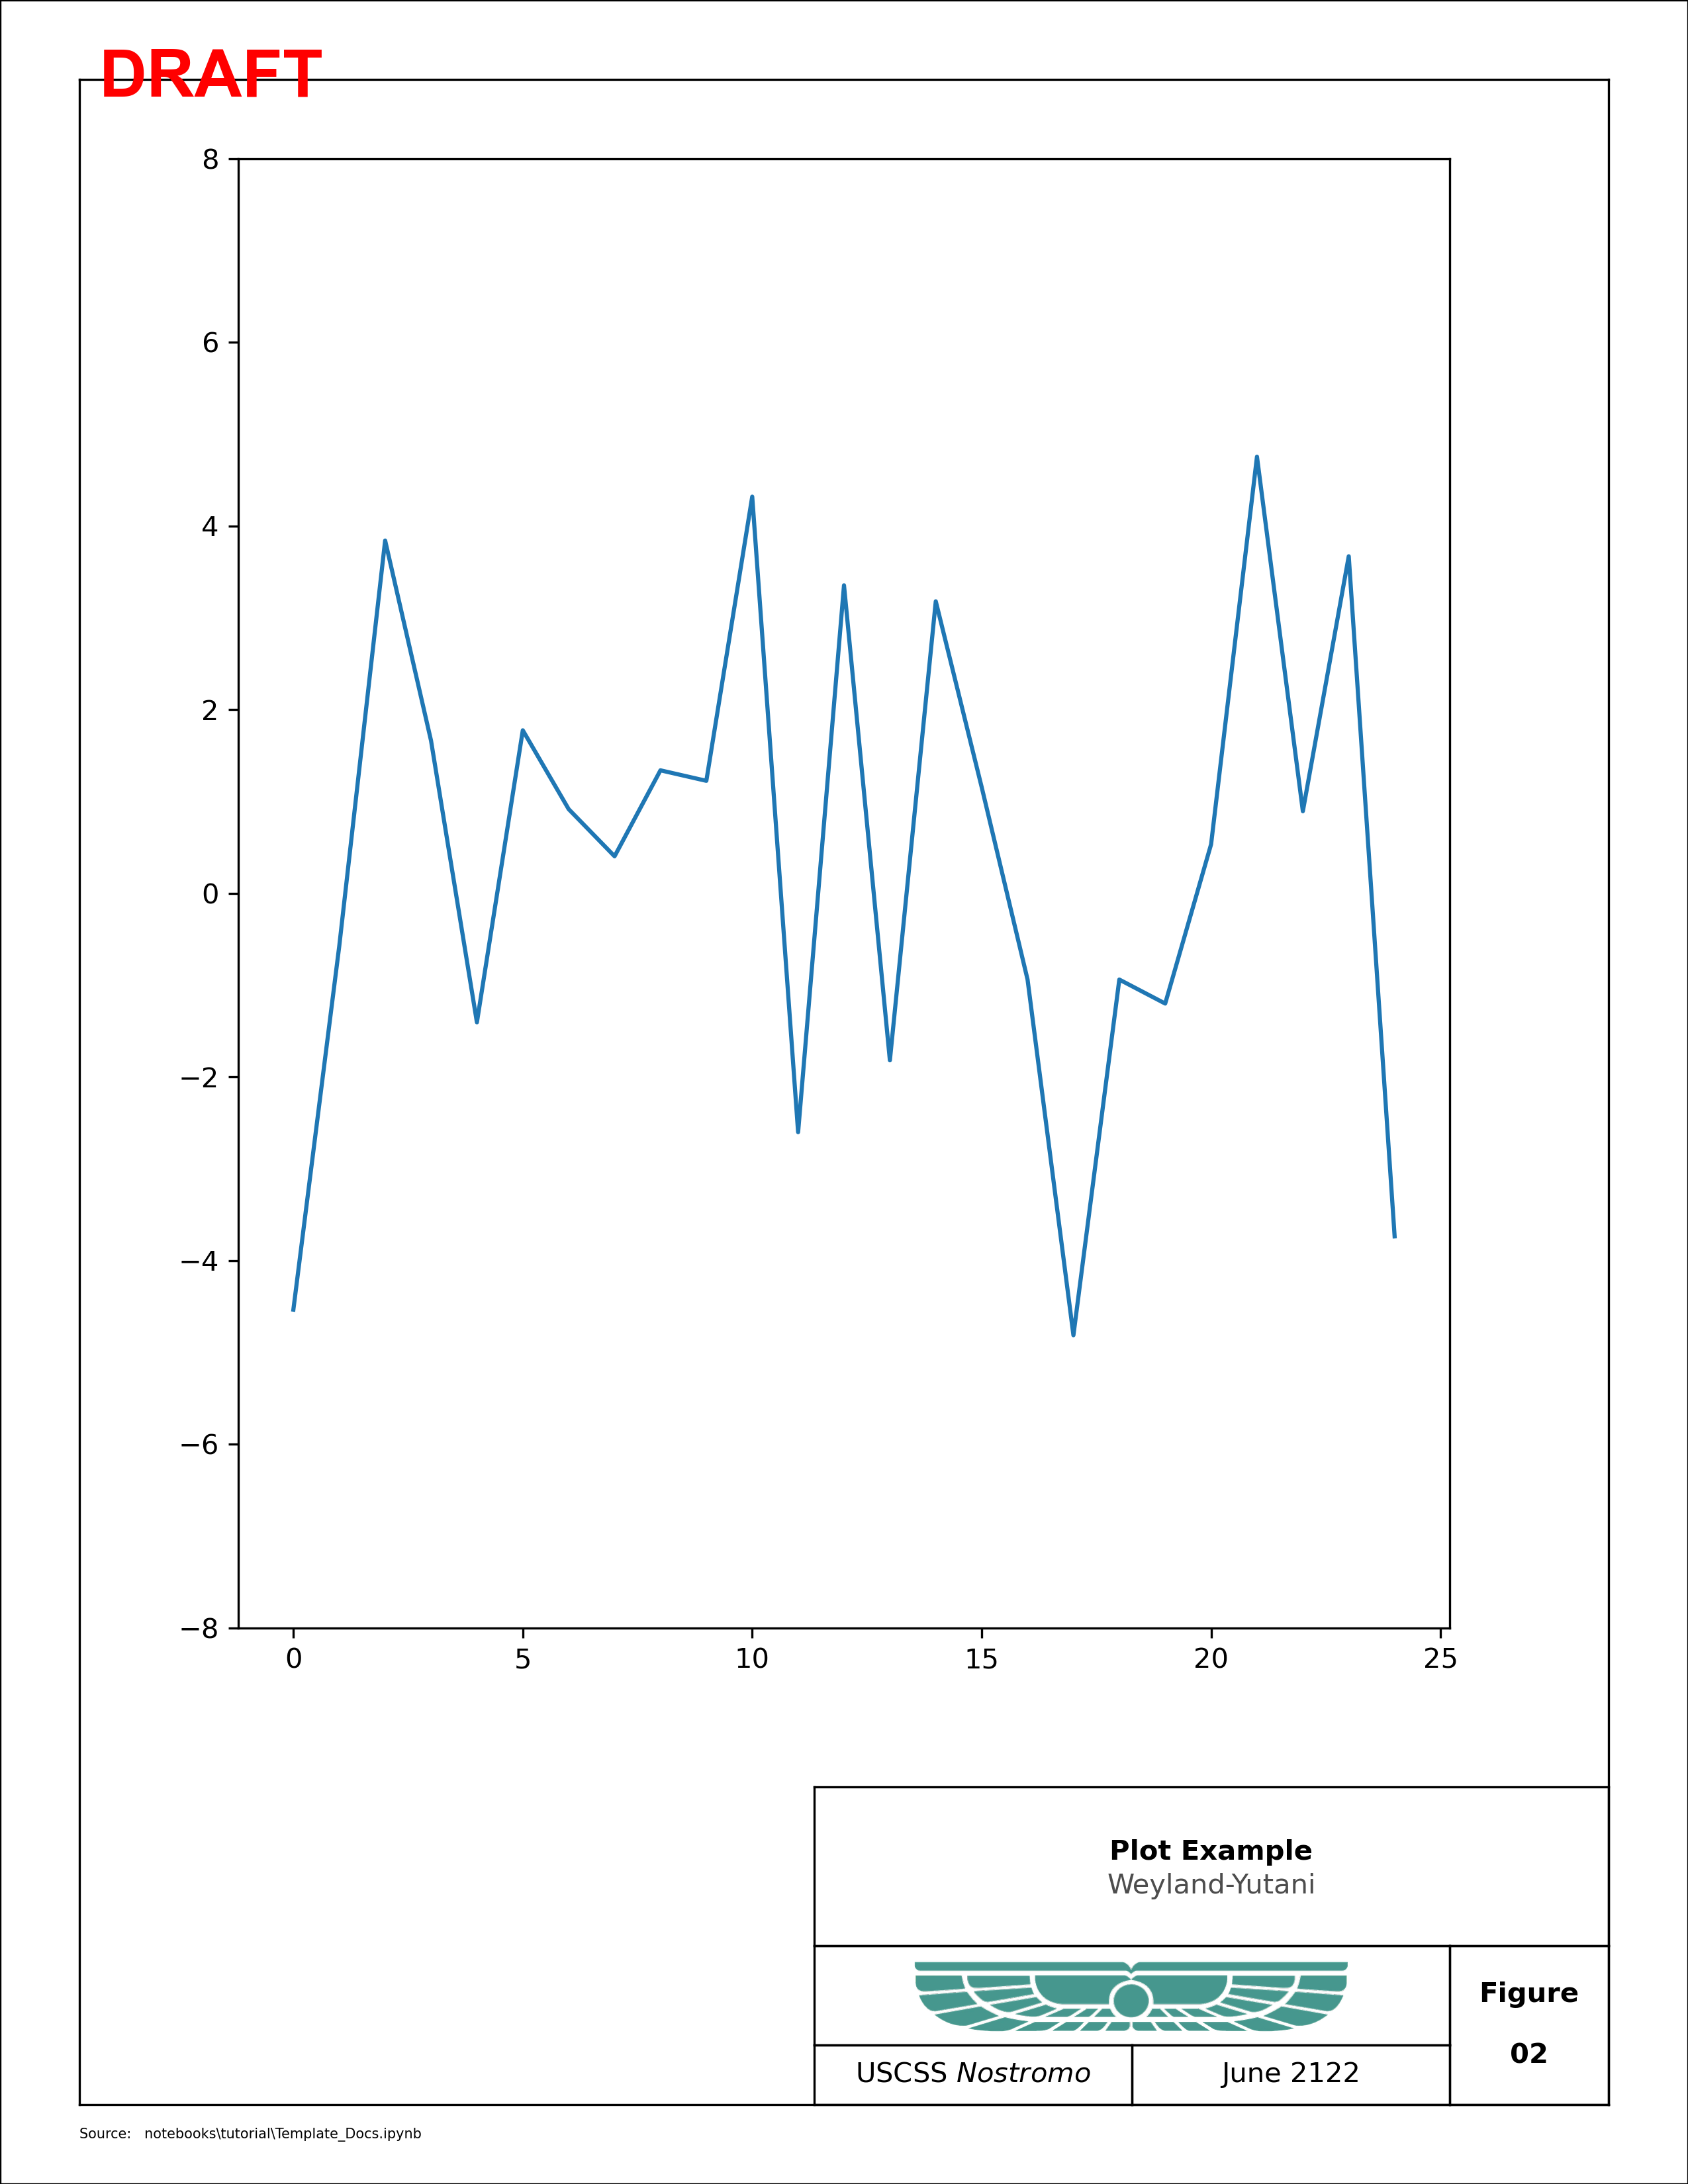
Inserting a Plot
A simple plot example is shown below that uses several methods to get locations of useful figure features.
[9]:
tbk = copy.deepcopy(TBK)
tbk[0]["text"][0]["s"] = "Plot Example"
tbk[4]["text"]["s"] = tbk[4]["text"]["s"].format(2)

report_fig = Template(figsize=(8.5, 11), scriptname=SCRIPT, titleblock_content=tbk)
report_fig.path_text = PATH

fig = report_fig.setup_figure()
# `setup_figure` performs add_frame(), add_titleblock(),
# add_path_text() and populate_titleblock(). It is the
# recommended way to create figures with the Template class

# create a sub-gridspec that will be used for the main image
left, right, top, bottom = report_fig.margins
main = report_fig.gsfig[
    4 + top : -(report_fig.t_h + bottom + 8), 8 + left : -(right + 8)
]

ax = fig.add_subplot(main)
plot = ax.plot([np.random.uniform(-1, 1) * 5 for i in range(25)])
_ = ax.set_ylim(-8, 8)
page = report_fig.add_page()
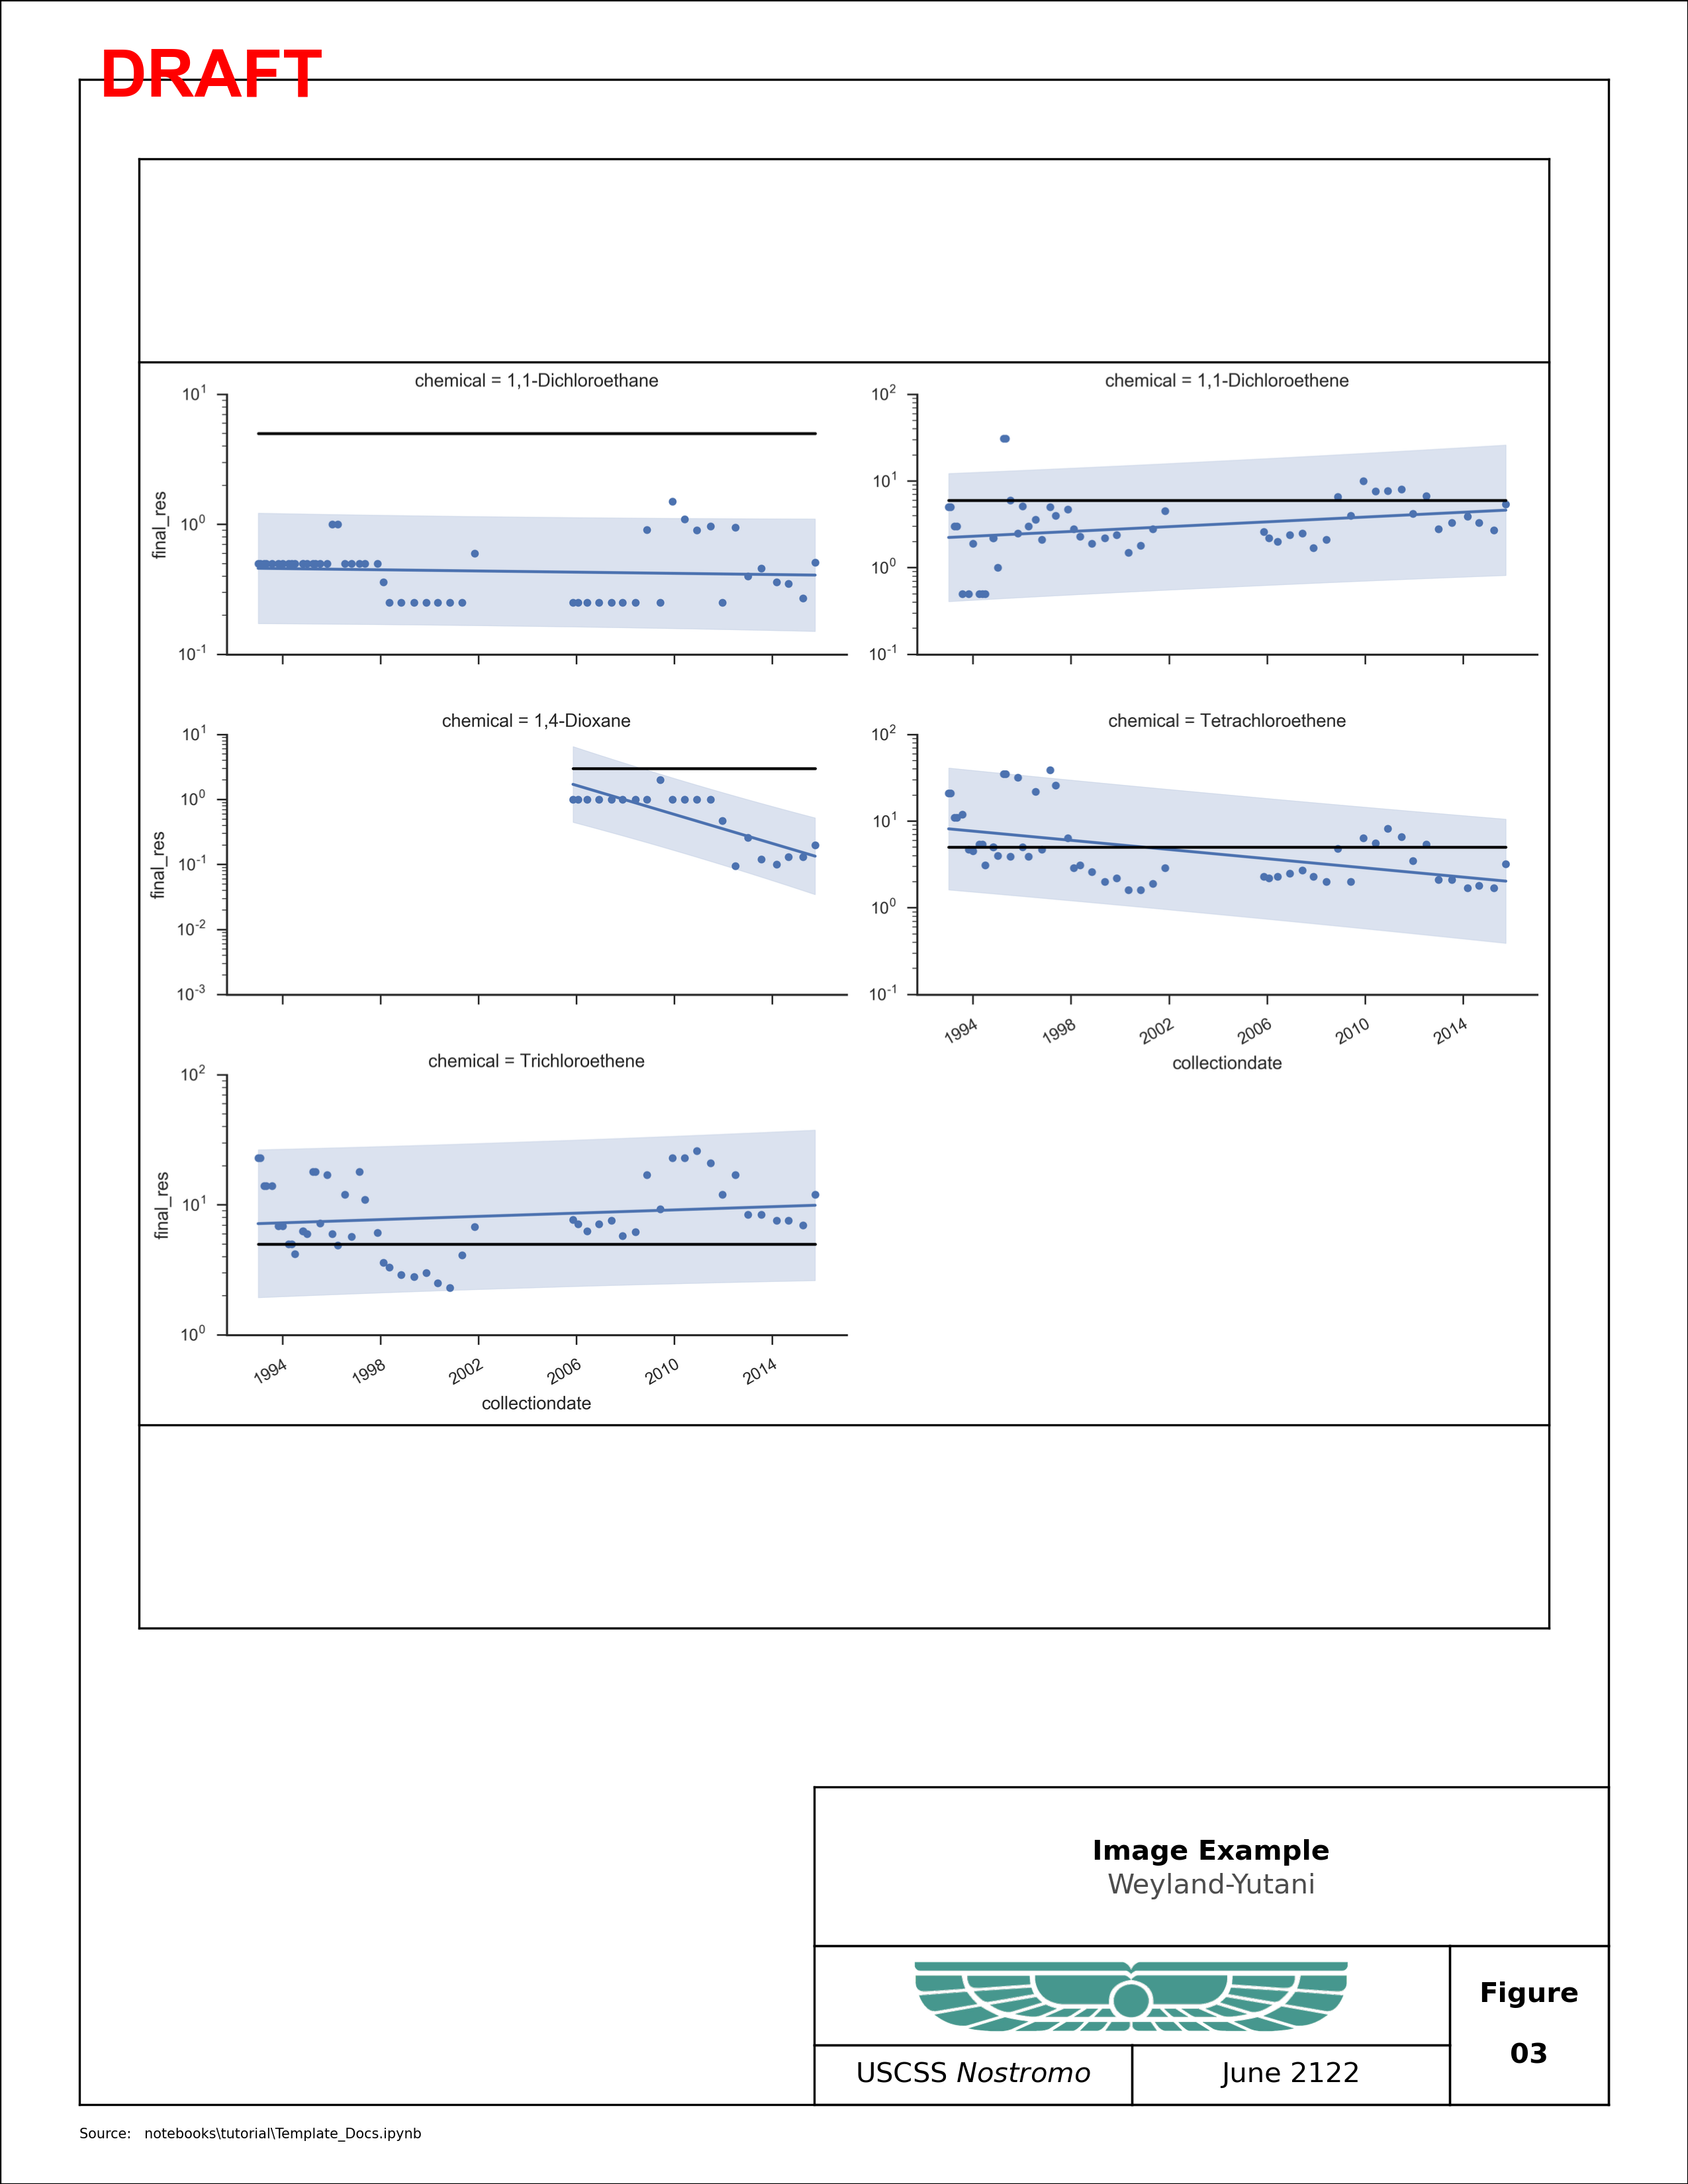
Inserting an Image
The template has an additional built in method for inserting images that are centered in the axes object and properly antialiased for the final resolution of the figure. The default value for saving/exporting figures using the Template module is 300 dpi. The insert_image() method also ensures that there is no stretching or other modification to the image that is being inserted.
[10]:
tbk = copy.deepcopy(TBK)
tbk[0]["text"][0]["s"] = "Image Example"
tbk[4]["text"]["s"] = tbk[4]["text"]["s"].format(3)

report_fig = Template(figsize=(8.5, 11), scriptname=SCRIPT, titleblock_content=tbk)

# create a sub-gridspec that will be used for the main image
left, right, top, bottom = report_fig.margins
main = report_fig.gsfig[
    4 + top : -(report_fig.t_h + bottom + 8), 3 + left : -(right + 3)
]

report_fig.path_text = PATH
fig = report_fig.setup_figure()

# "frameon = True" shows that the axes object that is being added
# is exactly the size and shape specified by the gridspec, but the image
# fills the largest dimension first.

ax = fig.add_subplot(main, xticks=[], yticks=[], frameon=True)

im_ax = insert_image(ax, "img/95_confidence.png", scale=1, dpi=fig.get_dpi())
im_ax.axis("on")
page = report_fig.add_page()
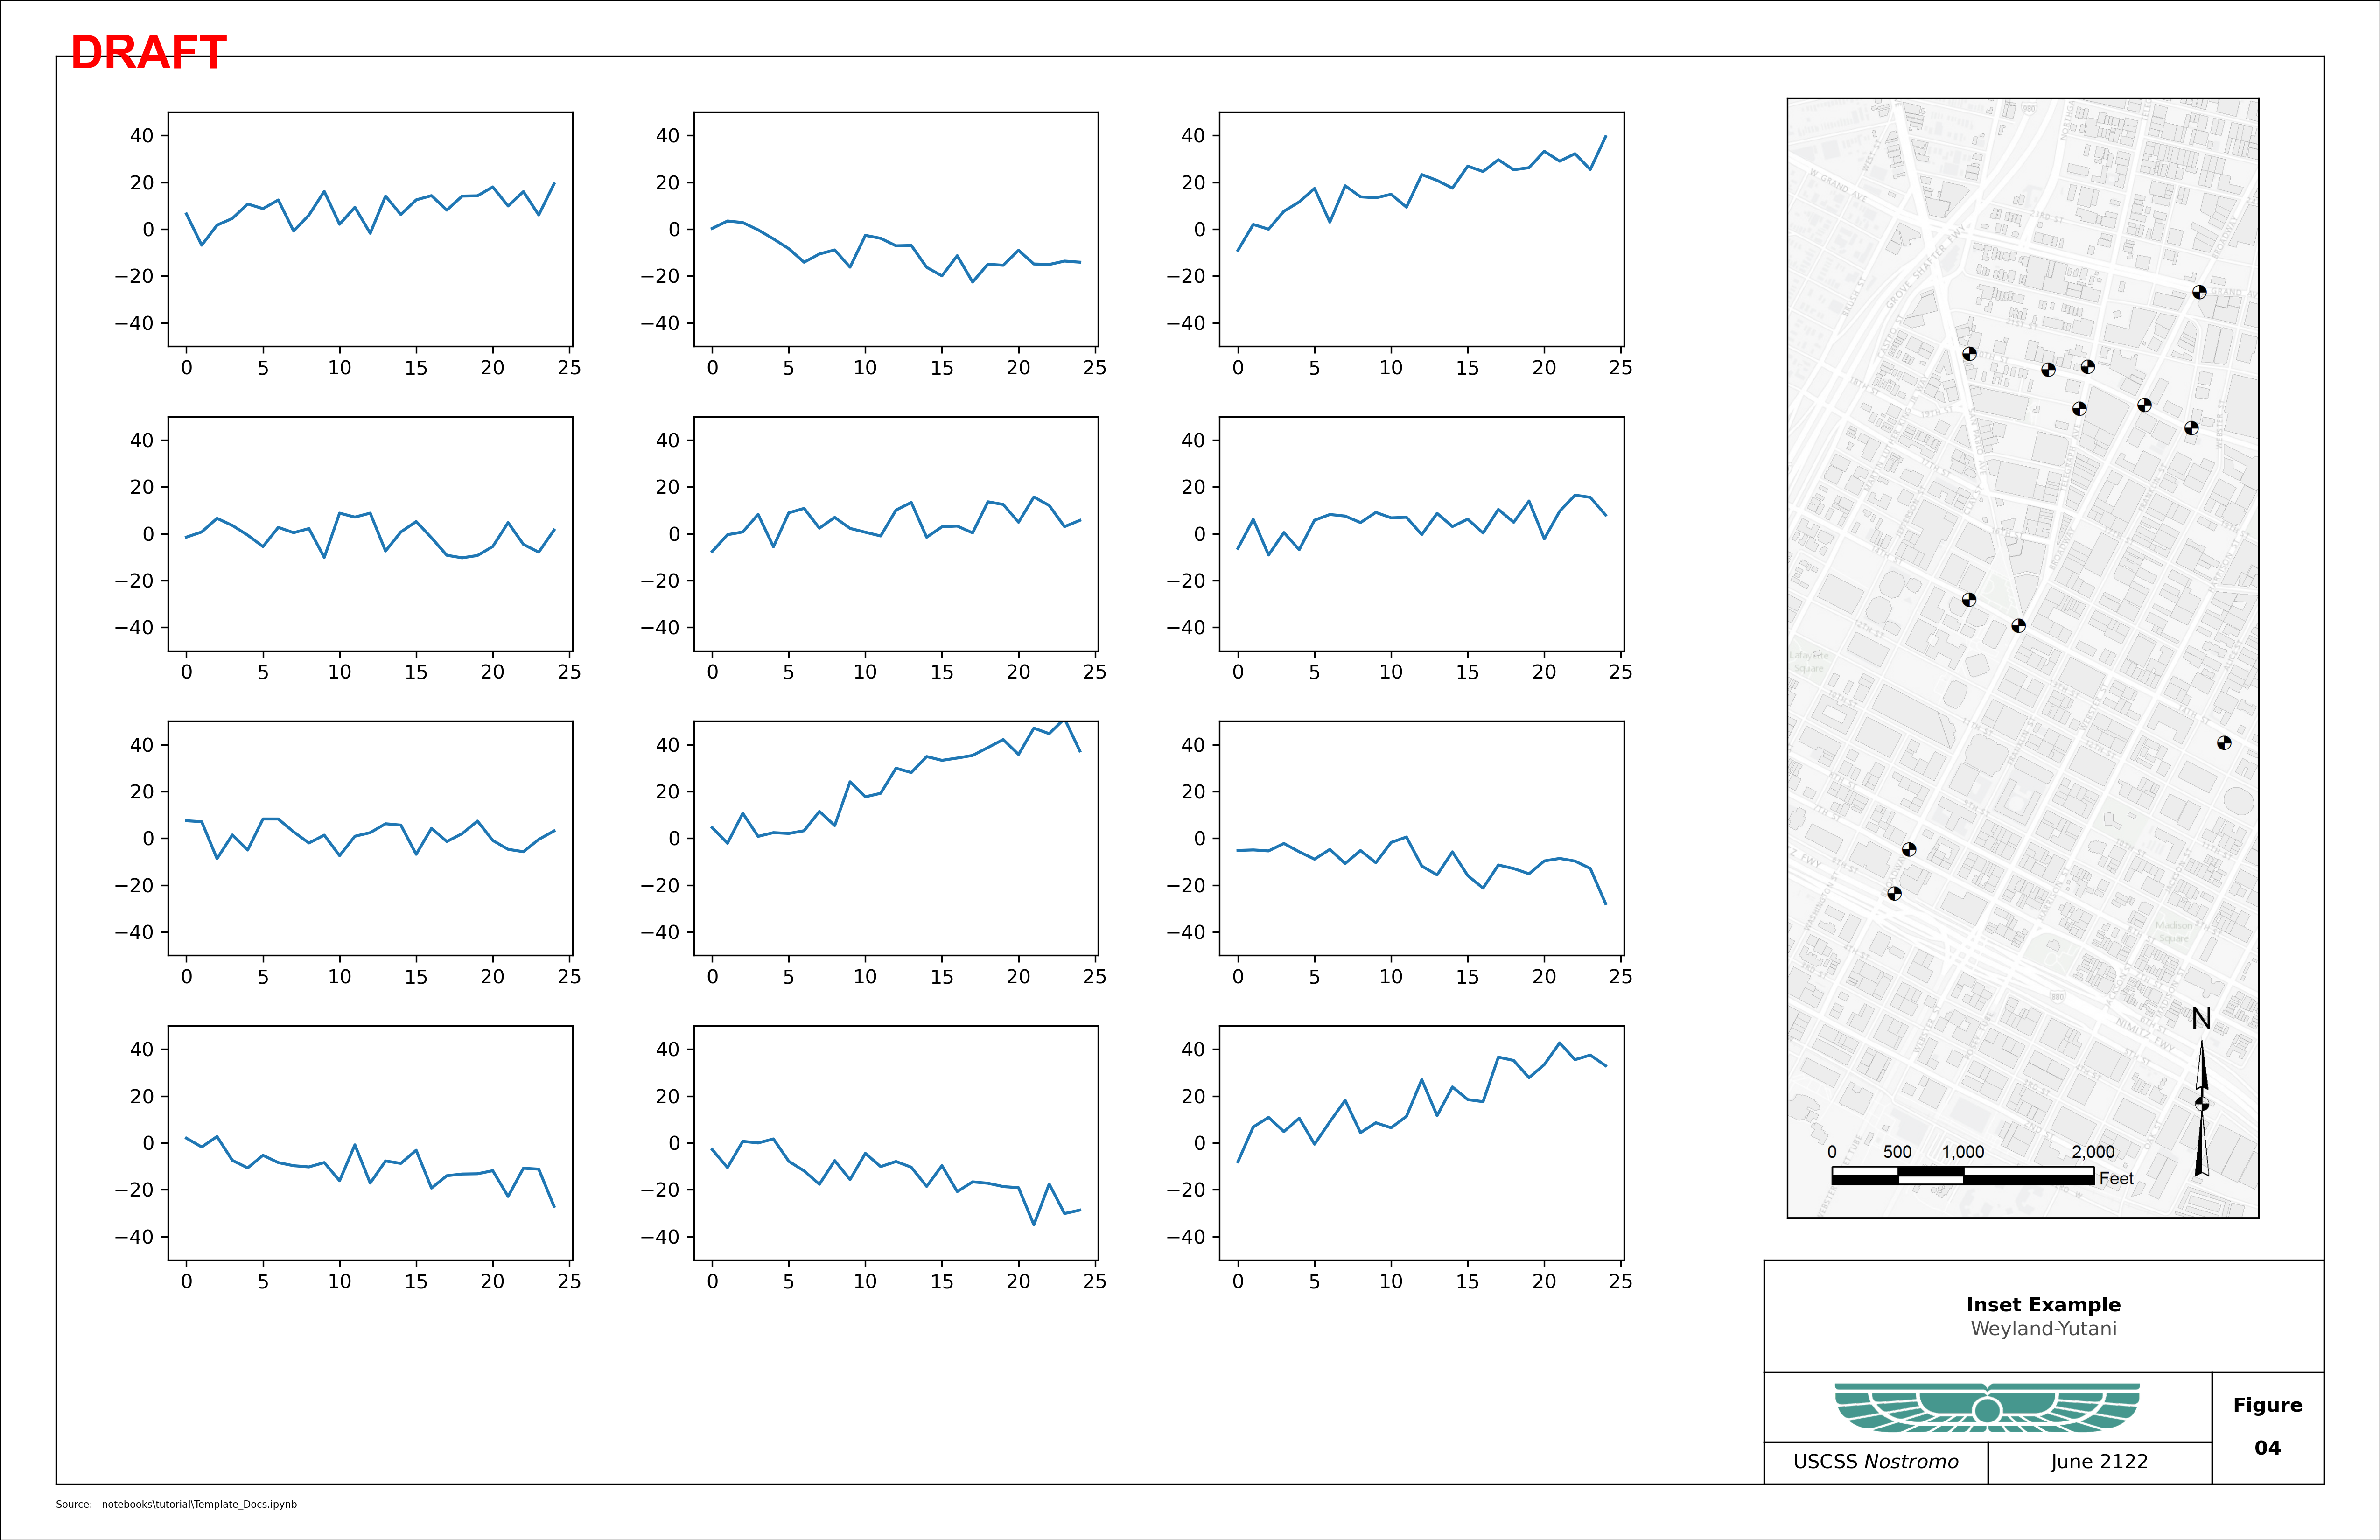
Plots with Insets
[11]:
tbk = copy.deepcopy(TBK)
tbk[0]["text"][0]["s"] = "Inset Example"
tbk[4]["text"]["s"] = tbk[4]["text"]["s"].format(4)

report_fig = Template(
    figsize=(17, 11),
    scriptname=SCRIPT,
    titleblock_content=tbk,
)
report_fig.path_text = PATH

main = report_fig.gsfig[
    4 + top : -(report_fig.t_h + bottom),
    8 + left : -(right + 50),
]
gs_timeseries = gs.GridSpecFromSubplotSpec(4, 3, main, hspace=0.3, wspace=0.3)

fig = report_fig.setup_figure()

for n in range(12):
    ax2 = fig.add_subplot(gs_timeseries[n])
    x = np.arange(25)
    y = np.random.uniform(-2, 2) * x + np.random.uniform(-10, 10, x.shape)
    ax2.set_ylim((-50, 50))
    ax2.plot(x, y)

inset = report_fig.gsfig[
    3 + top : -(report_fig.t_h + bottom + 3),
    -(report_fig.t_w + right) : -(right + 3),
]

inset_ax = fig.add_subplot(inset)
inset_ax.set_axis_off()

img = insert_image(inset_ax, "img/Template_Inset.png", scale=1)

page = report_fig.add_page()
Advanced Features
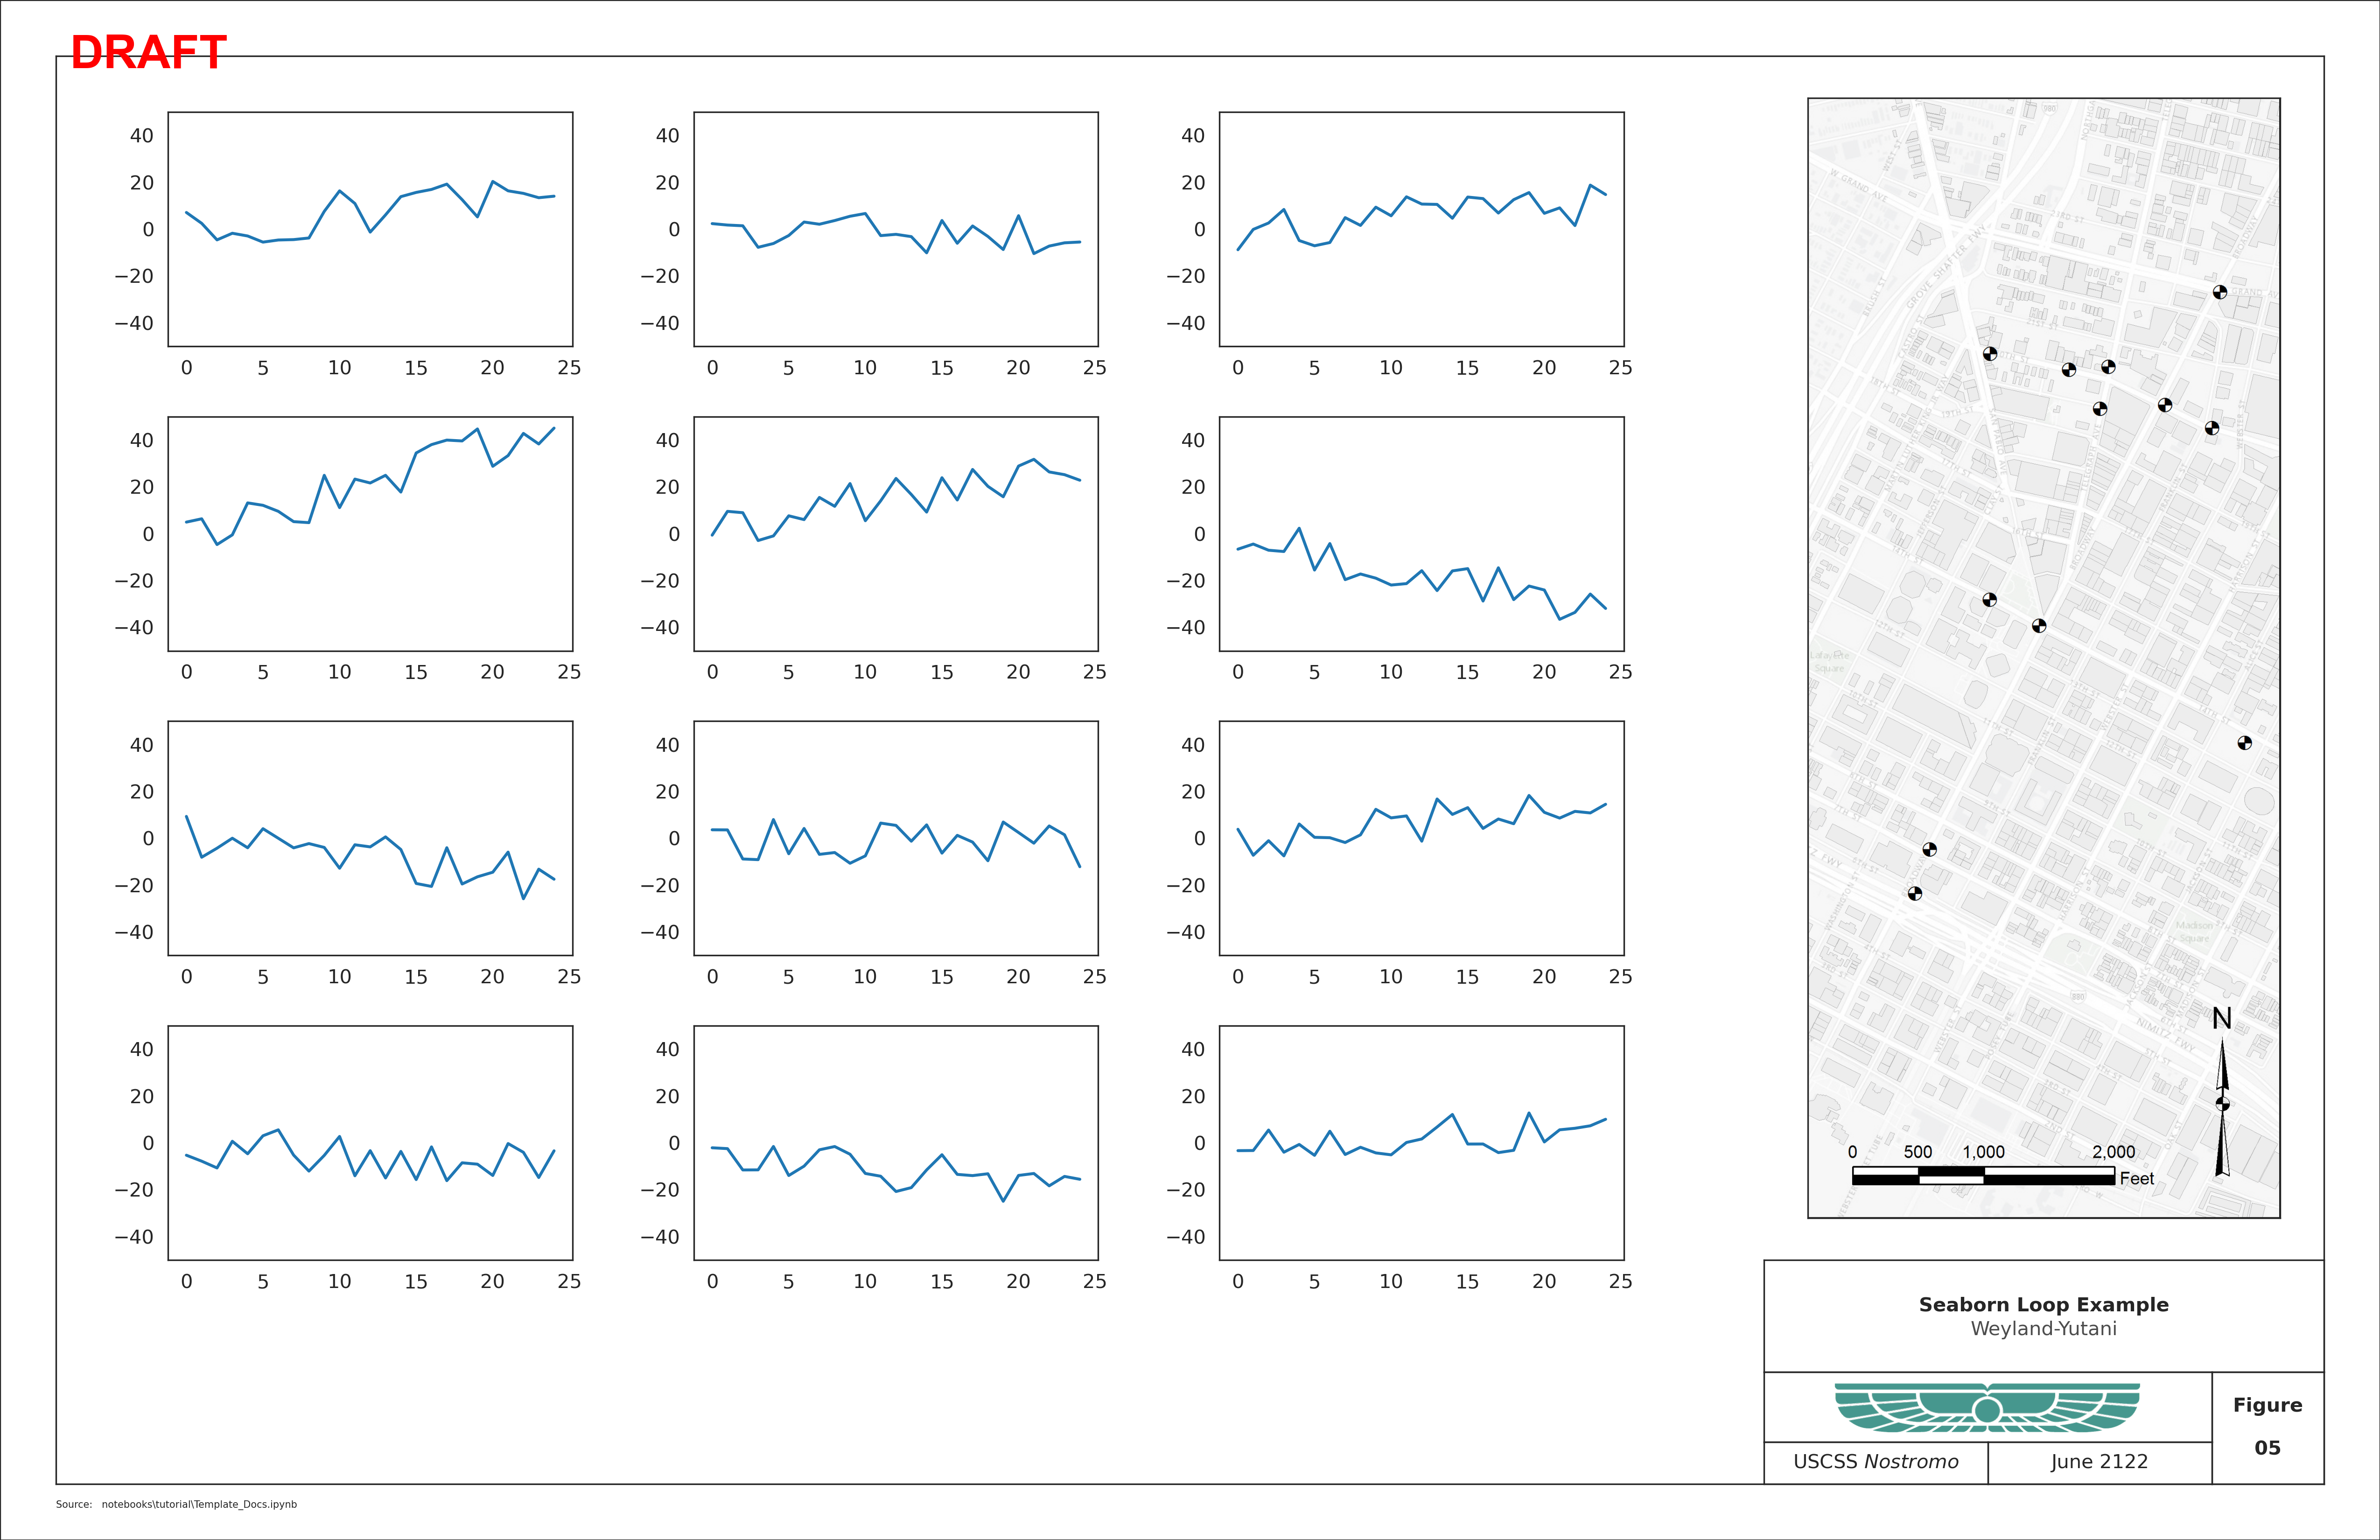
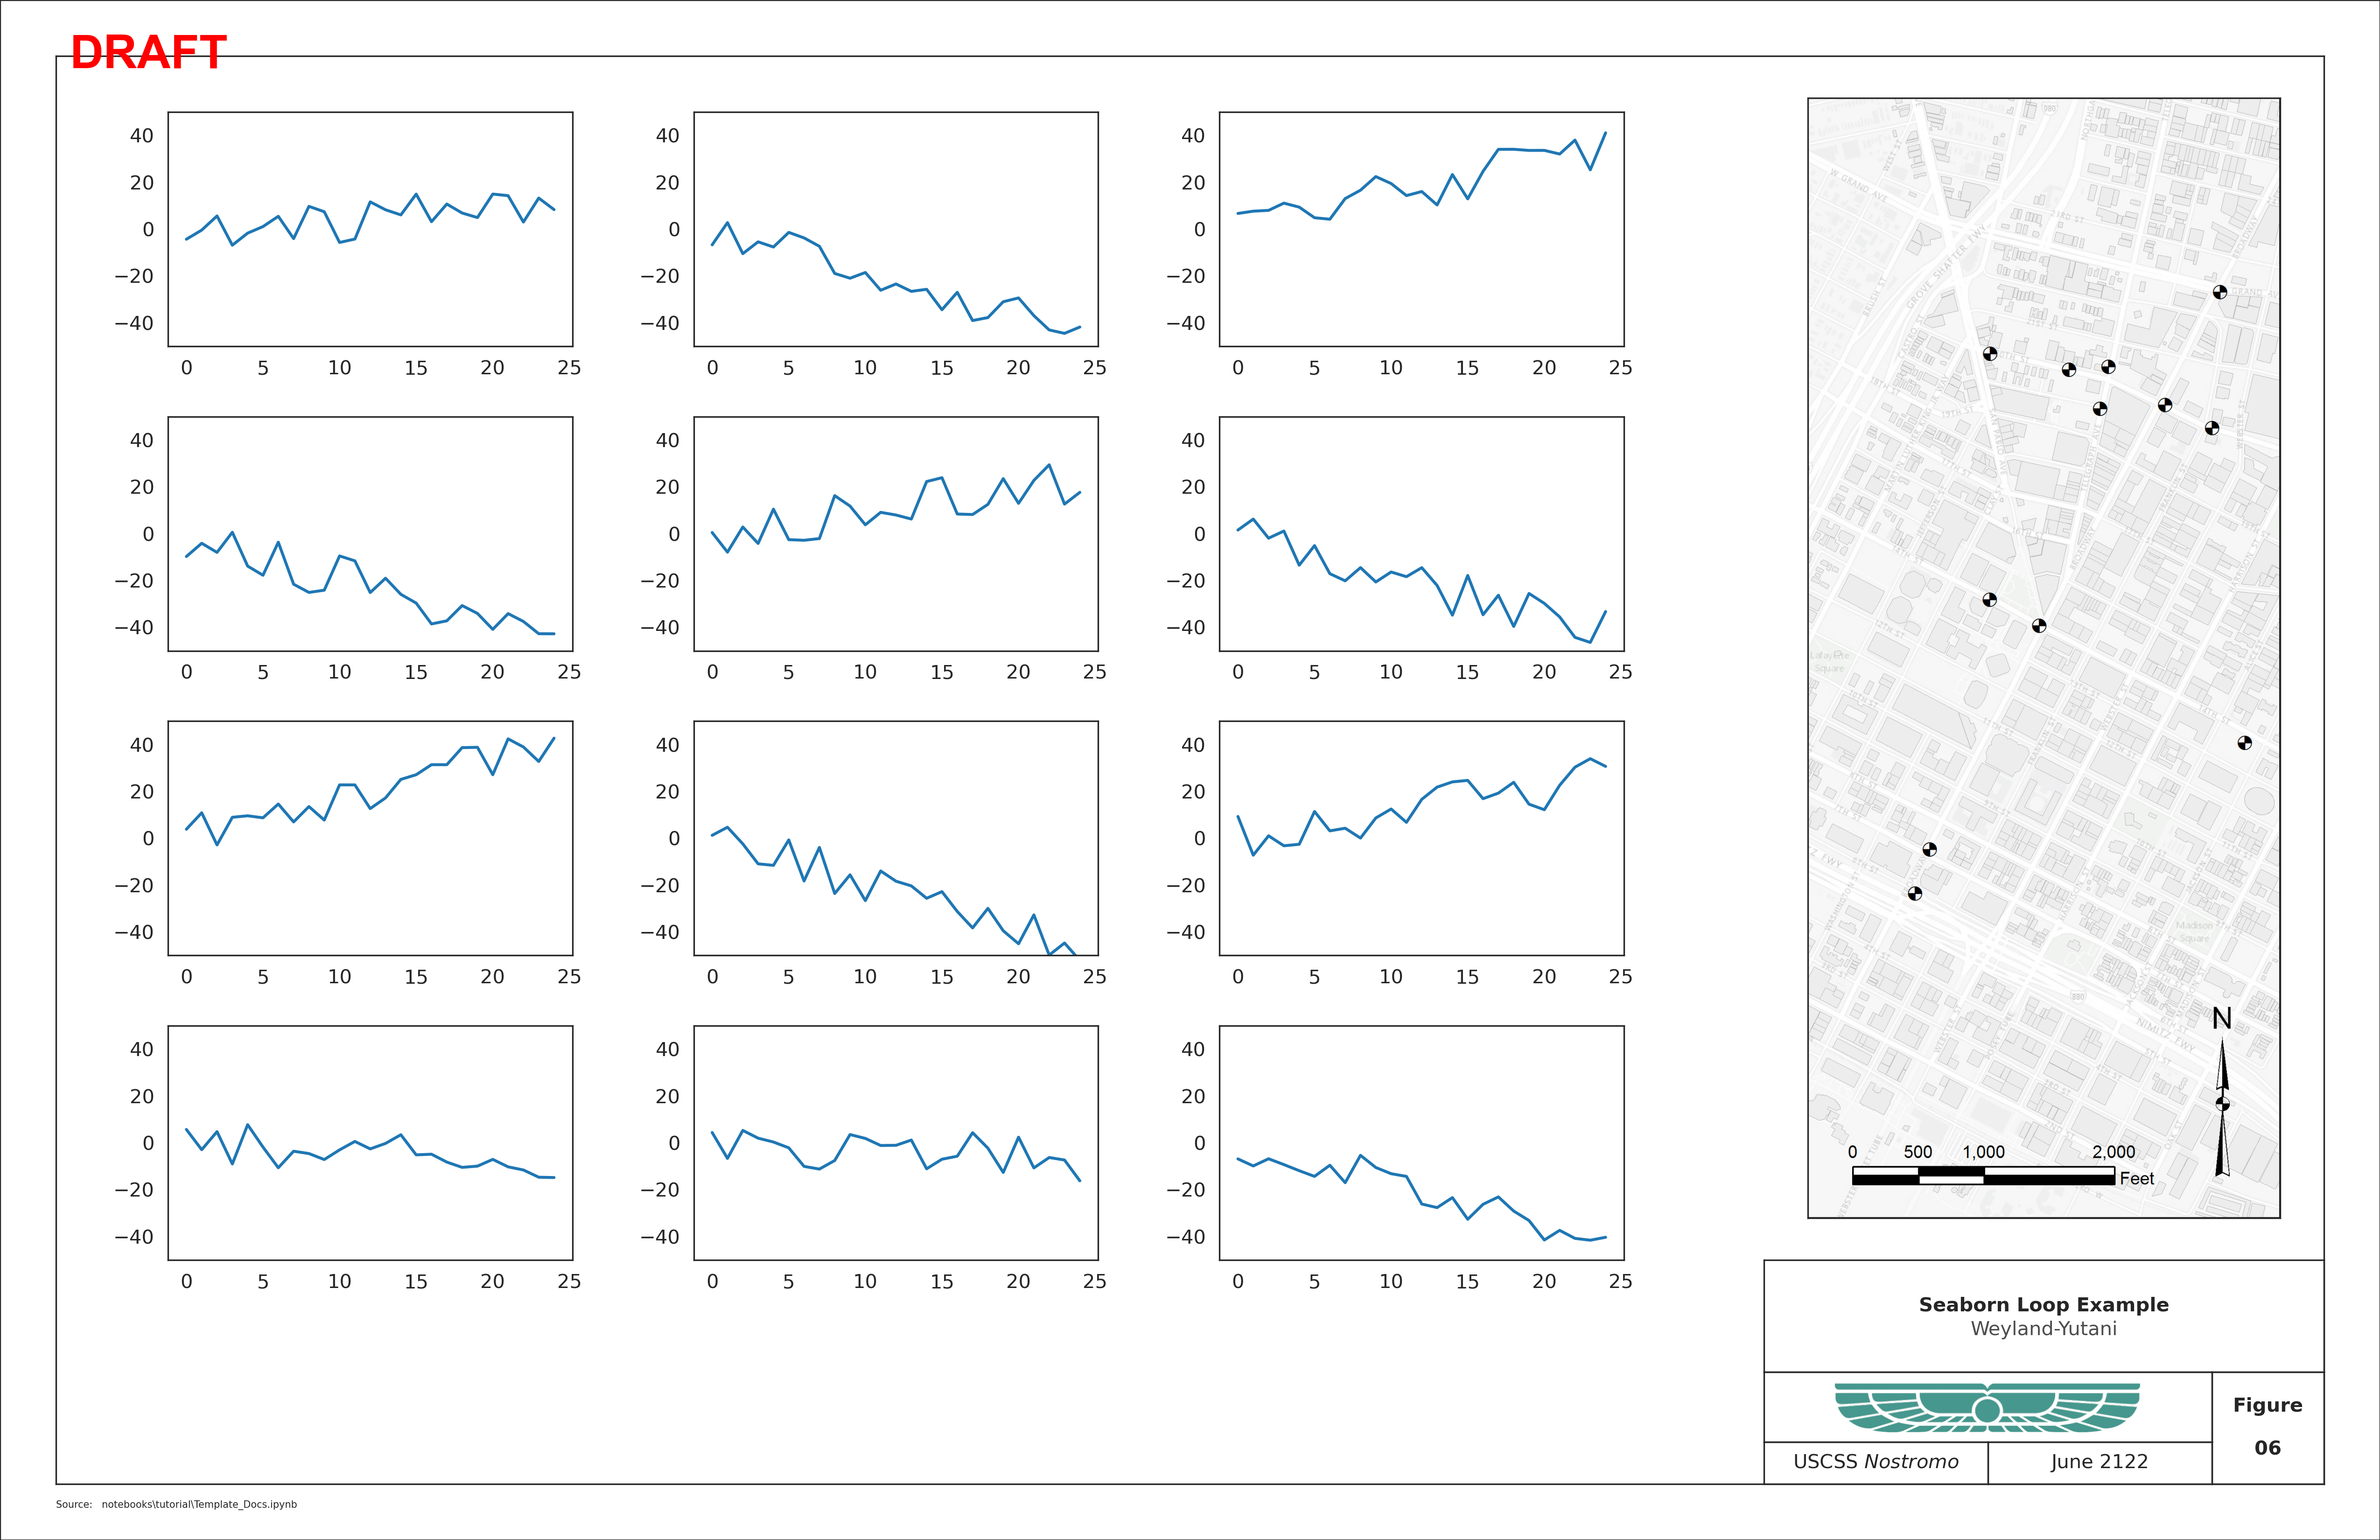
Compatability with Seaborn
[12]:
import seaborn as sns

for i in range(2):
    with sns.axes_style("white"):
        tbk = copy.deepcopy(TBK)
        tbk[0]["text"][0]["s"] = "Seaborn Loop Example"
        tbk[4]["text"]["s"] = tbk[4]["text"]["s"].format(i + 5)

        report_fig = Template(
            figsize=(17, 11),
            scriptname=SCRIPT,
            titleblock_content=tbk,
        )
        report_fig.path_text = PATH

        left, right, top, bottom = report_fig.margins
        main = report_fig.gsfig[
            4 + top : -(report_fig.t_h + bottom),
            8 + left : -(right + 50),
        ]
        gs_timeseries = gs.GridSpecFromSubplotSpec(
            4,
            3,
            main,
            hspace=0.3,
            wspace=0.3,
        )
        fig = report_fig.setup_figure()

        for n in range(12):
            ax2 = fig.add_subplot(gs_timeseries[n])
            x = np.arange(25)
            y = np.random.uniform(-2, 2) * x + np.random.uniform(-10, 10, x.shape)
            ax2.set_ylim((-50, 50))
            ax2.plot(x, y)

        inset = report_fig.gsfig[
            3 + top : -(report_fig.t_h + bottom + 3),
            -(report_fig.t_w + right) : -right,
        ]

        inset_ax = fig.add_subplot(inset)
        inset_ax.set_axis_off()

        img = insert_image(inset_ax, "img/Template_Inset.png", scale=1)
        page = report_fig.add_page()
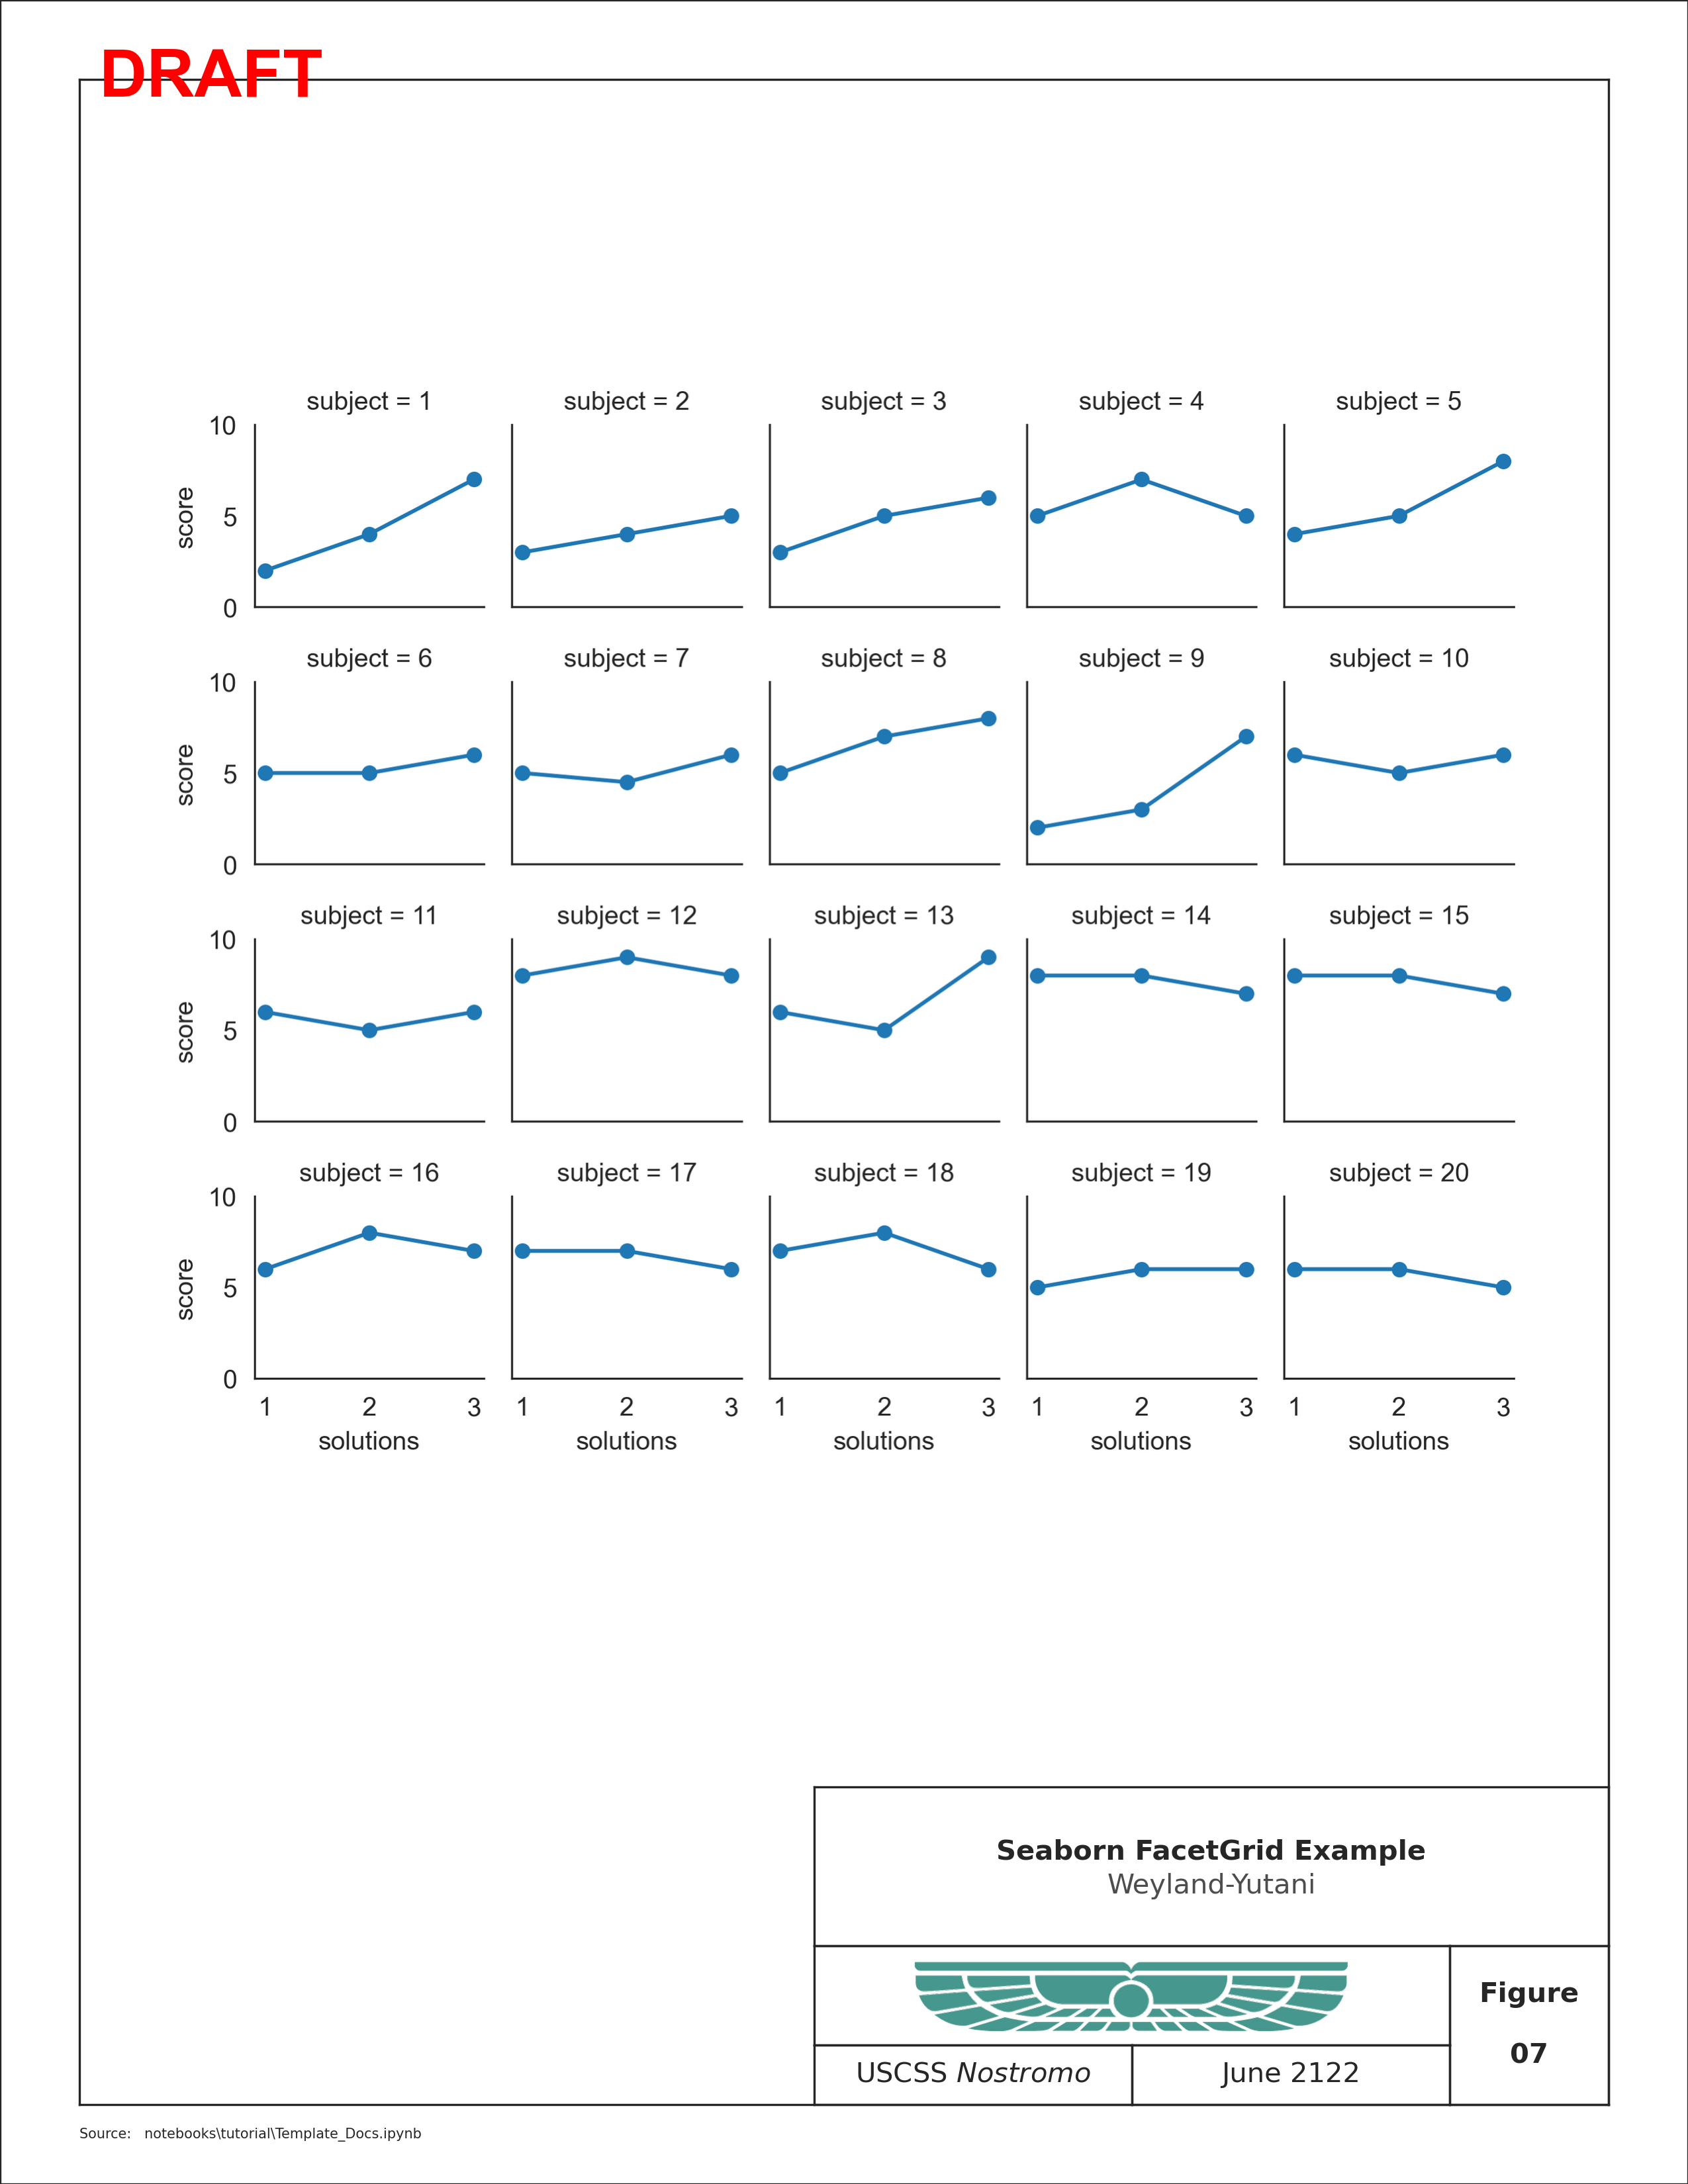
FacetGrid
Seaborn’s facetgrid cannot be made directly compatable with this module (to my knowledge) because of it’s implicit call to plt.subplots() or plt.figure() to generate the figure necessary to produce multiple axes in a subplot axes grid. For now, creating a temporary png file of the facet grid and loading it as an image is one way around this
limitation. Update: matplotlib has added a subfigure api that might make this possible, but it’s compatibly with this package is (presently) untested.
[13]:
with sns.axes_style("white"):
    tbk = copy.deepcopy(TBK)
    tbk[0]["text"][0]["s"] = "Seaborn FacetGrid Example"
    tbk[4]["text"]["s"] = tbk[4]["text"]["s"].format(7)

    report_fig = Template(
        figsize=(8.5, 11),
        scriptname=SCRIPT,
        titleblock_content=tbk,
    )
    report_fig.path_text = PATH

    attend = sns.load_dataset("attention")
    g = sns.FacetGrid(attend, col="subject", col_wrap=5, height=1.5, ylim=(0, 10))
    g = g.map(plt.plot, "solutions", "score", marker=".", markersize=10)
    g.savefig("img/Facet_Grid.png", dpi=300)
    plt.close()

    left, right, top, bottom = report_fig.margins
    main = report_fig.gsfig[top : -(report_fig.t_h + bottom + 1), left:-(right)]

    fig = report_fig.setup_figure()

    ax = fig.add_subplot(main, xticks=[], yticks=[], frameon=False)
    g_ax = insert_image(ax, "img/Facet_Grid.png", scale=0.9, frameon=False)

    page = report_fig.add_page()
Custom Titleblock Specifications
The Template Module is highly customizable using the titleblock_content, titleblock_rows and titleblock_cols kwargs when constructing the object. The rows and columns should be tuples specifying the high level grid structure of the titleblock, and the titleblock content should contain a list of dictionaries (one for each box) with a 'span' key.
Spans are given as gridspec lists of indices of the grids to span. The pattern for gridspec is [r0:r,c0:c] where r0 is the top of the vertical span of rows, and c0 is the left element of the horizontal span of the columns. The span list should provide these indices in order, e.g. [r0,r,c0,c].
Defaults are shown below:
[14]:
report_fig = Template(figsize=(8.5, 11), scriptname=SCRIPT)

print("Default titleblock_cols = (16, 16, 8)")
print("Default titleblock_rows = (8, 5, 3)")
report_fig.default_spans
Default titleblock_cols = (16, 16, 8)
Default titleblock_rows = (8, 5, 3)
[14]:
[{'span': [0, 8, 0, 40]},
 {'span': [8, 13, 0, 32]},
 {'span': [13, 16, 0, 16]},
 {'span': [13, 16, 16, 32]},
 {'span': [8, 16, 32, 40]}]
Defaults can be adjusted with the titleblock_rows and titleblock_cols. It’s even possible to align the titleblock anywhere on the figure using gridspec.
The titleblock can be moved using the gstitleblock attribute of the template.Template() class.
[15]:
with sns.axes_style("white"):
    tbk = copy.deepcopy(TBK)
    tbk[0]["text"][0]["s"] = " Wide Titleblock on Left"
    tbk[4]["text"]["s"] = tbk[4]["text"]["s"].format(8)

    report_fig = Template(
        figsize=(8.5, 11),
        scriptname=SCRIPT,
        titleblock_rows=(8, 5, 5),
        titleblock_cols=(30, 20, 10),
        margins=(1, 2, 3, 4),
        titleblock_content=tbk,
    )
    report_fig.path_text = PATH
    report_fig.gstitleblock = report_fig.gsfig[
        -(report_fig.bottom + report_fig.t_h) or None : -report_fig.bottom or None,
        (report_fig.left) or None : (report_fig.left + report_fig.t_w) or None,
    ]

    fig = report_fig.setup_figure()
    page = report_fig.add_page()

It’s also possible to blend the definitions of spans and use an existing titleblock specification to populate the adjusted boxes. Notice that the specifications from the TBK occupy different cells than before because their spans have been defined differently by new_spans.
[16]:
new_spans = [
    {"span": [0, 8, 0, 32]},
    {"span": [13, 16, 16, 30]},
    {"span": [13, 16, 0, 16]},
    {"span": [8, 13, 0, 32]},
    {"span": [0, 13, 32, 40]},
    {"span": [13, 16, 30, 40]},
]

update = copy.deepcopy(TBK)
for i, dct in enumerate(update):
    dct.update(new_spans[i])

with sns.axes_style("white"):
    tbk = copy.deepcopy(update)
    tbk[0]["text"][0]["s"] = "Custom Titleblock Example"
    tbk[4]["text"]["s"] = tbk[4]["text"]["s"].format(8)

    report_fig = Template(figsize=(8.5, 11), scriptname=SCRIPT, titleblock_content=tbk)
    report_fig.path_text = PATH
    fig = report_fig.setup_figure()
    page = report_fig.add_page()

Fully Custom Titleblock
[17]:
fully_custom = [
    {
        "span": [0, 32, 0, 16],
        "name": "title",
        "text": [
            {
                "ha": "center",
                "s": "Test Custom Block",
                "va": "baseline",
                "weight": "bold",
                "x": 0.5,
                "y": 0.52,
            },
            {
                "color": (0.3, 0.3, 0.3),
                "ha": "center",
                "s": "Blank Example",
                "va": "top",
                "weight": "light",
                "x": 0.5,
                "y": 0.48,
            },
        ],
    },
    {
        "name": "logo",
        "image": {
            "path": "img/logo.png",
            "scale": 0.6,
            "axes": {
                "zorder": 101,
            },
        },
        "span": [0, 32, 16, 32],
        "axes": {
            "facecolor": "lightgrey",
        },
    },
    {
        "name": "fignum",
        "text": {
            "s": "5",
            "x": 0.5,
            "y": 0.5,
            "ha": "center",
            "va": "center",
        },
        "span": [0, 32, 32, 48],
    },
]

with sns.axes_style("white"):
    report_fig = Template(
        figsize=(8.5, 11),
        scriptname=SCRIPT,
        titleblock_content=fully_custom,
    )
    report_fig.path_text = PATH
    fig = report_fig.setup_figure()

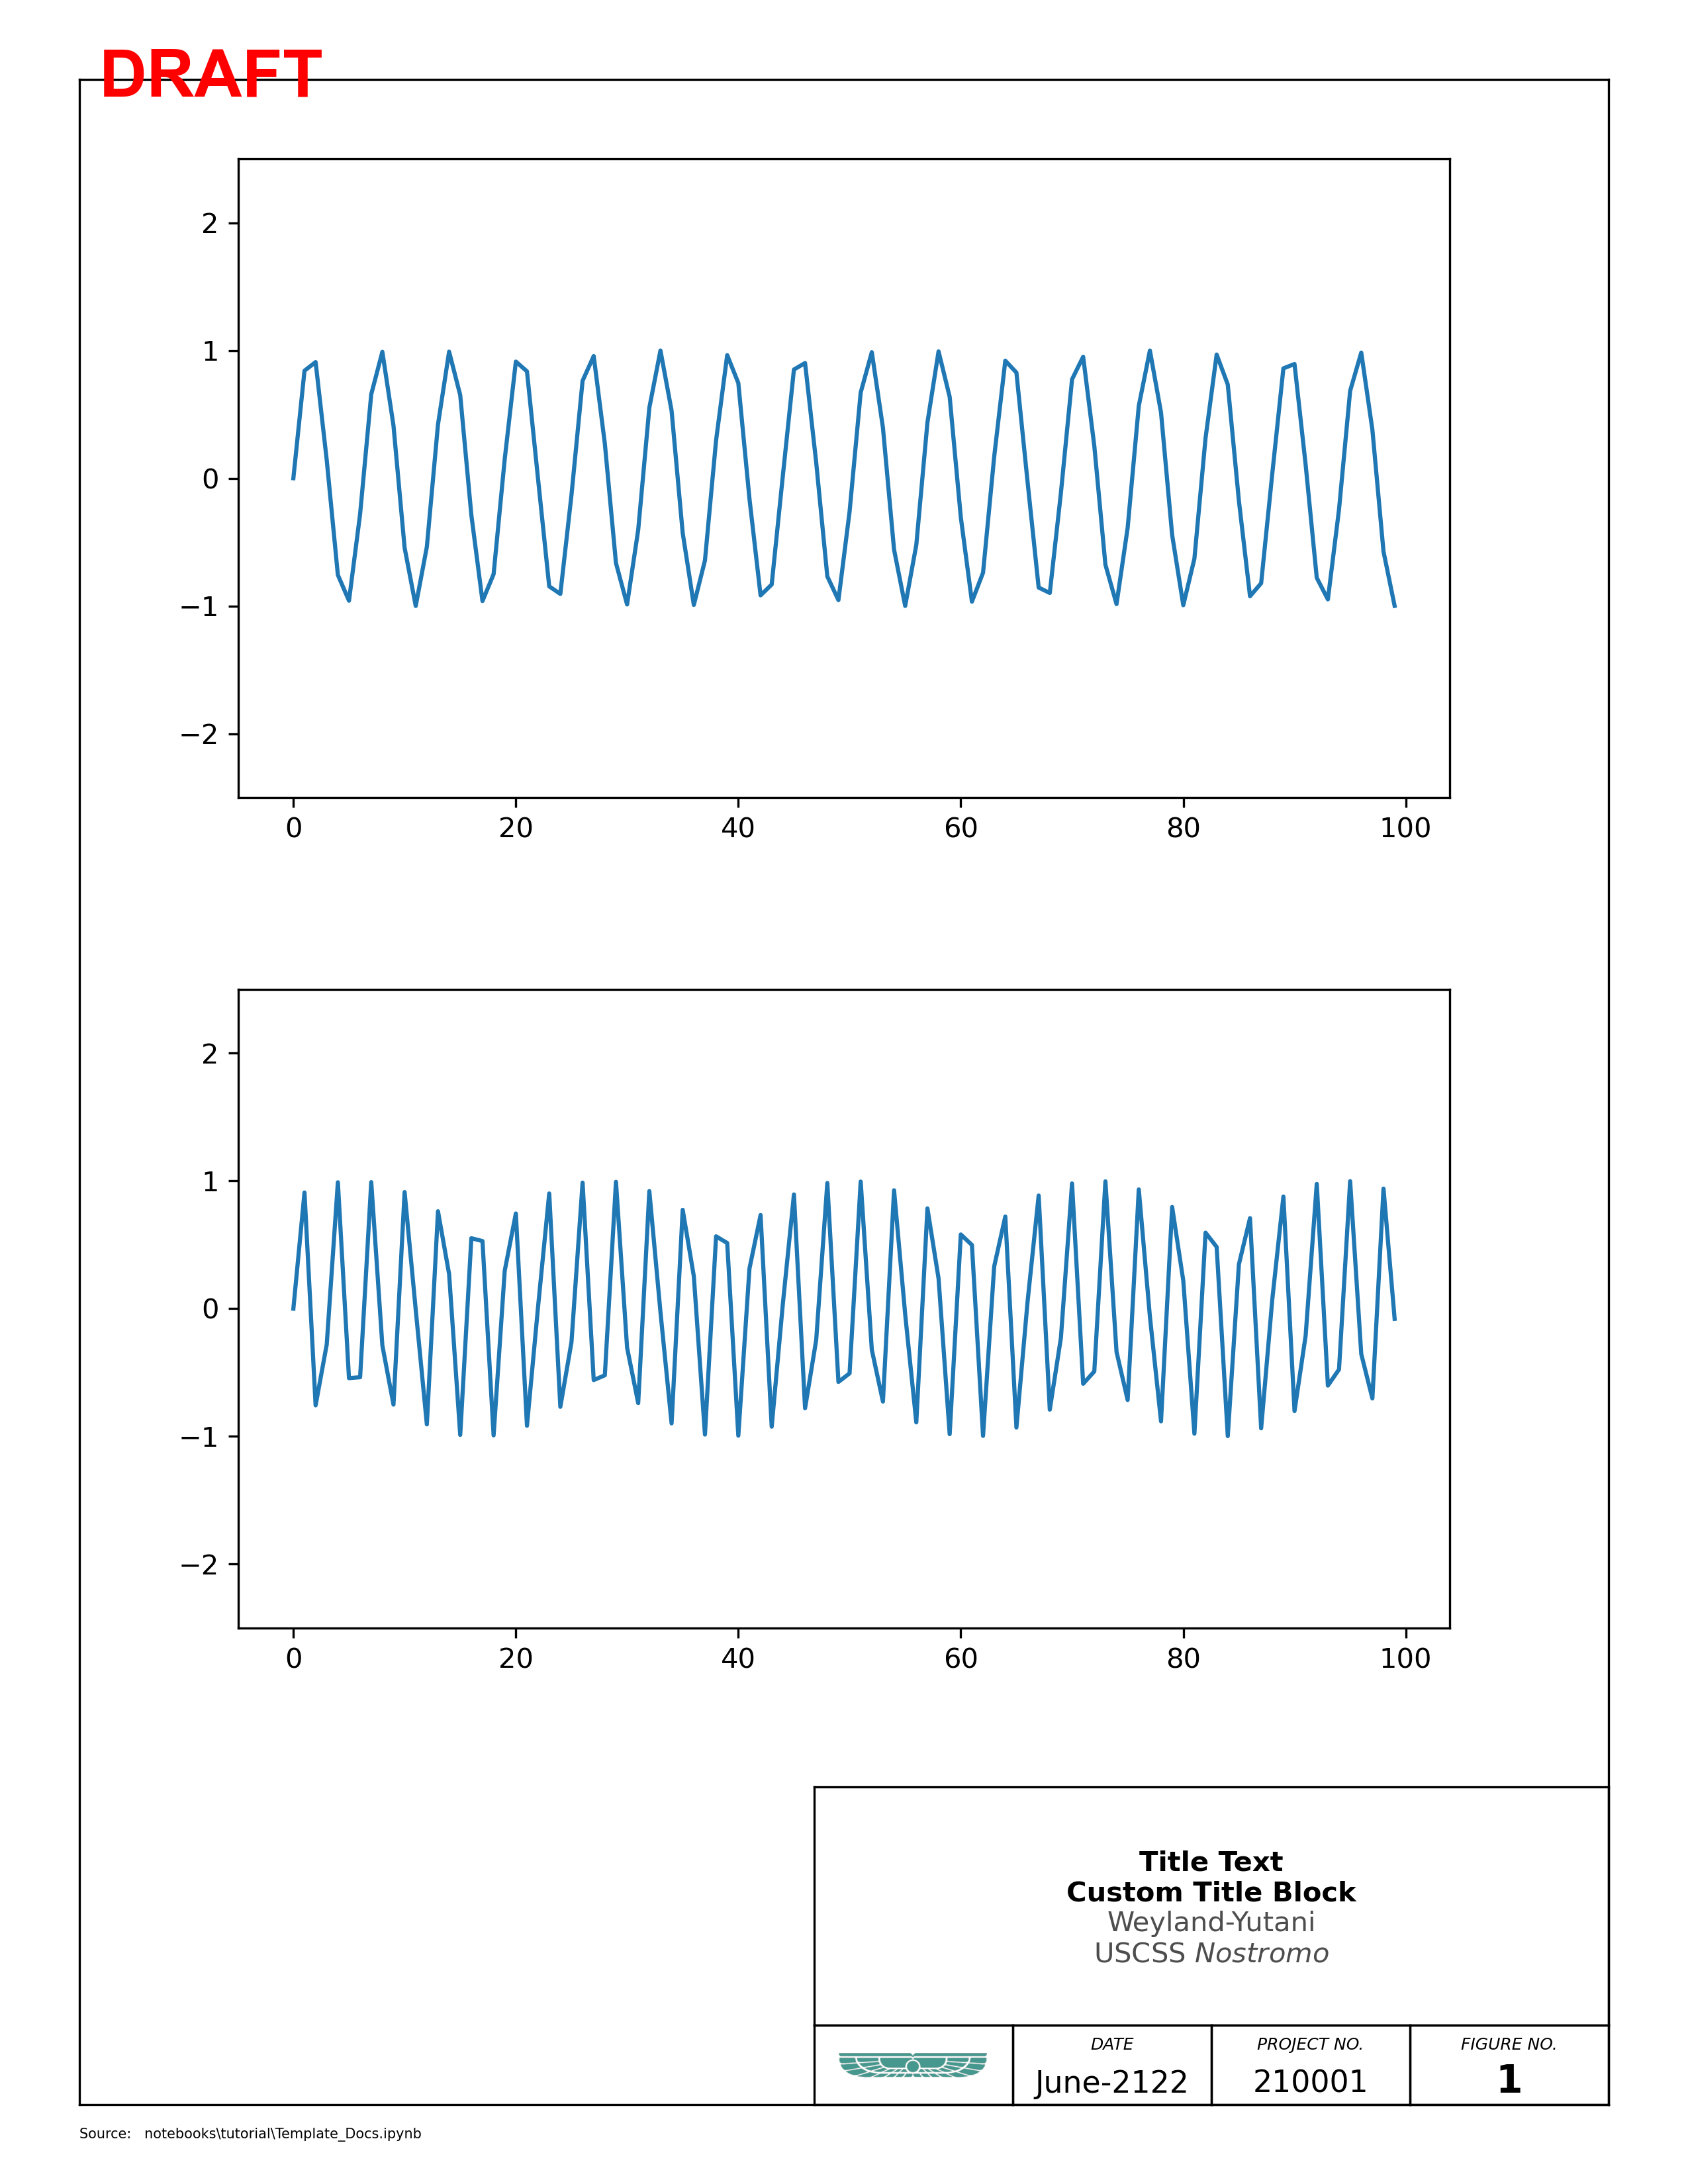
[18]:
fully_custom = [
    {
        "span": [0, 12, 0, 40],
        "name": "title",
        "text": [
            {
                "ha": "center",
                "s": "Title Text\nCustom Title Block",
                "va": "baseline",
                "weight": "bold",
                "x": 0.5,
                "y": 0.52,
            },
            {
                "color": (0.3, 0.3, 0.3),
                "ha": "center",
                "s": "Weyland-Yutani\nUSCSS $Nostromo$",
                "va": "top",
                "weight": "light",
                "x": 0.5,
                "y": 0.48,
            },
        ],
    },
    {
        "name": "logo",
        "image": {
            "path": "img/logo.png",
            "scale": 0.75,
        },
        "span": [12, 16, 0, 10],
    },
    {
        "name": "date",
        "text": [
            {
                "ha": "center",
                "s": "DATE",
                "va": "top",
                "fontsize": 6,
                "fontstyle": "italic",
                "x": 0.5,
                "y": 0.85,
            },
            {
                "s": "June-2122",
                "x": 0.5,
                "y": 0.15,
                "fontsize": 11,
                "ha": "center",
                "va": "baseline",
            },
        ],
        "span": [12, 16, 10, 20],
    },
    {
        "name": "proj",
        "text": [
            {
                "ha": "center",
                "s": "PROJECT NO.",
                "va": "top",
                "fontsize": 6,
                "fontstyle": "italic",
                "x": 0.5,
                "y": 0.85,
            },
            {
                "ha": "center",
                "s": "210001",
                "va": "baseline",
                "fontsize": 11,
                "x": 0.5,
                "y": 0.15,
            },
        ],
        "span": [12, 16, 20, 30],
    },
    {
        "name": "fignum",
        "text": [
            {
                "ha": "center",
                "s": "FIGURE NO.",
                "va": "top",
                "fontsize": 6,
                "fontstyle": "italic",
                "x": 0.5,
                "y": 0.85,
            },
            {
                "ha": "center",
                "s": "1",
                "va": "baseline",
                "weight": "bold",
                "fontsize": 14,
                "x": 0.5,
                "y": 0.15,
            },
        ],
        "span": [12, 16, 30, 40],
    },
]


report_fig = Template(
    figsize=(8.5, 11),
    scriptname=SCRIPT,
    titleblock_content=fully_custom,
)
report_fig.path_text = PATH
_ = report_fig.add_frame()
tblk_axlist = report_fig.add_titleblock()
_ = report_fig.populate_titleblock()
_ = report_fig.add_path_text()

# create a sub-gridspec that will be used for the main image
left, right, top, bottom = report_fig.margins
main = report_fig.gsfig[
    4 + top : -(report_fig.t_h + bottom + 8), 8 + left : -(right + 8)
]
gs_timeseries = gs.GridSpecFromSubplotSpec(2, 1, main, hspace=0.3, wspace=0.3)

for n in range(2):
    ax = report_fig.fig.add_subplot(gs_timeseries[n])
    ax.set_ylim(-2.5, 2.5)
    plot = ax.plot([np.sin(i * (n + 1)) for i in range(0, 100)])
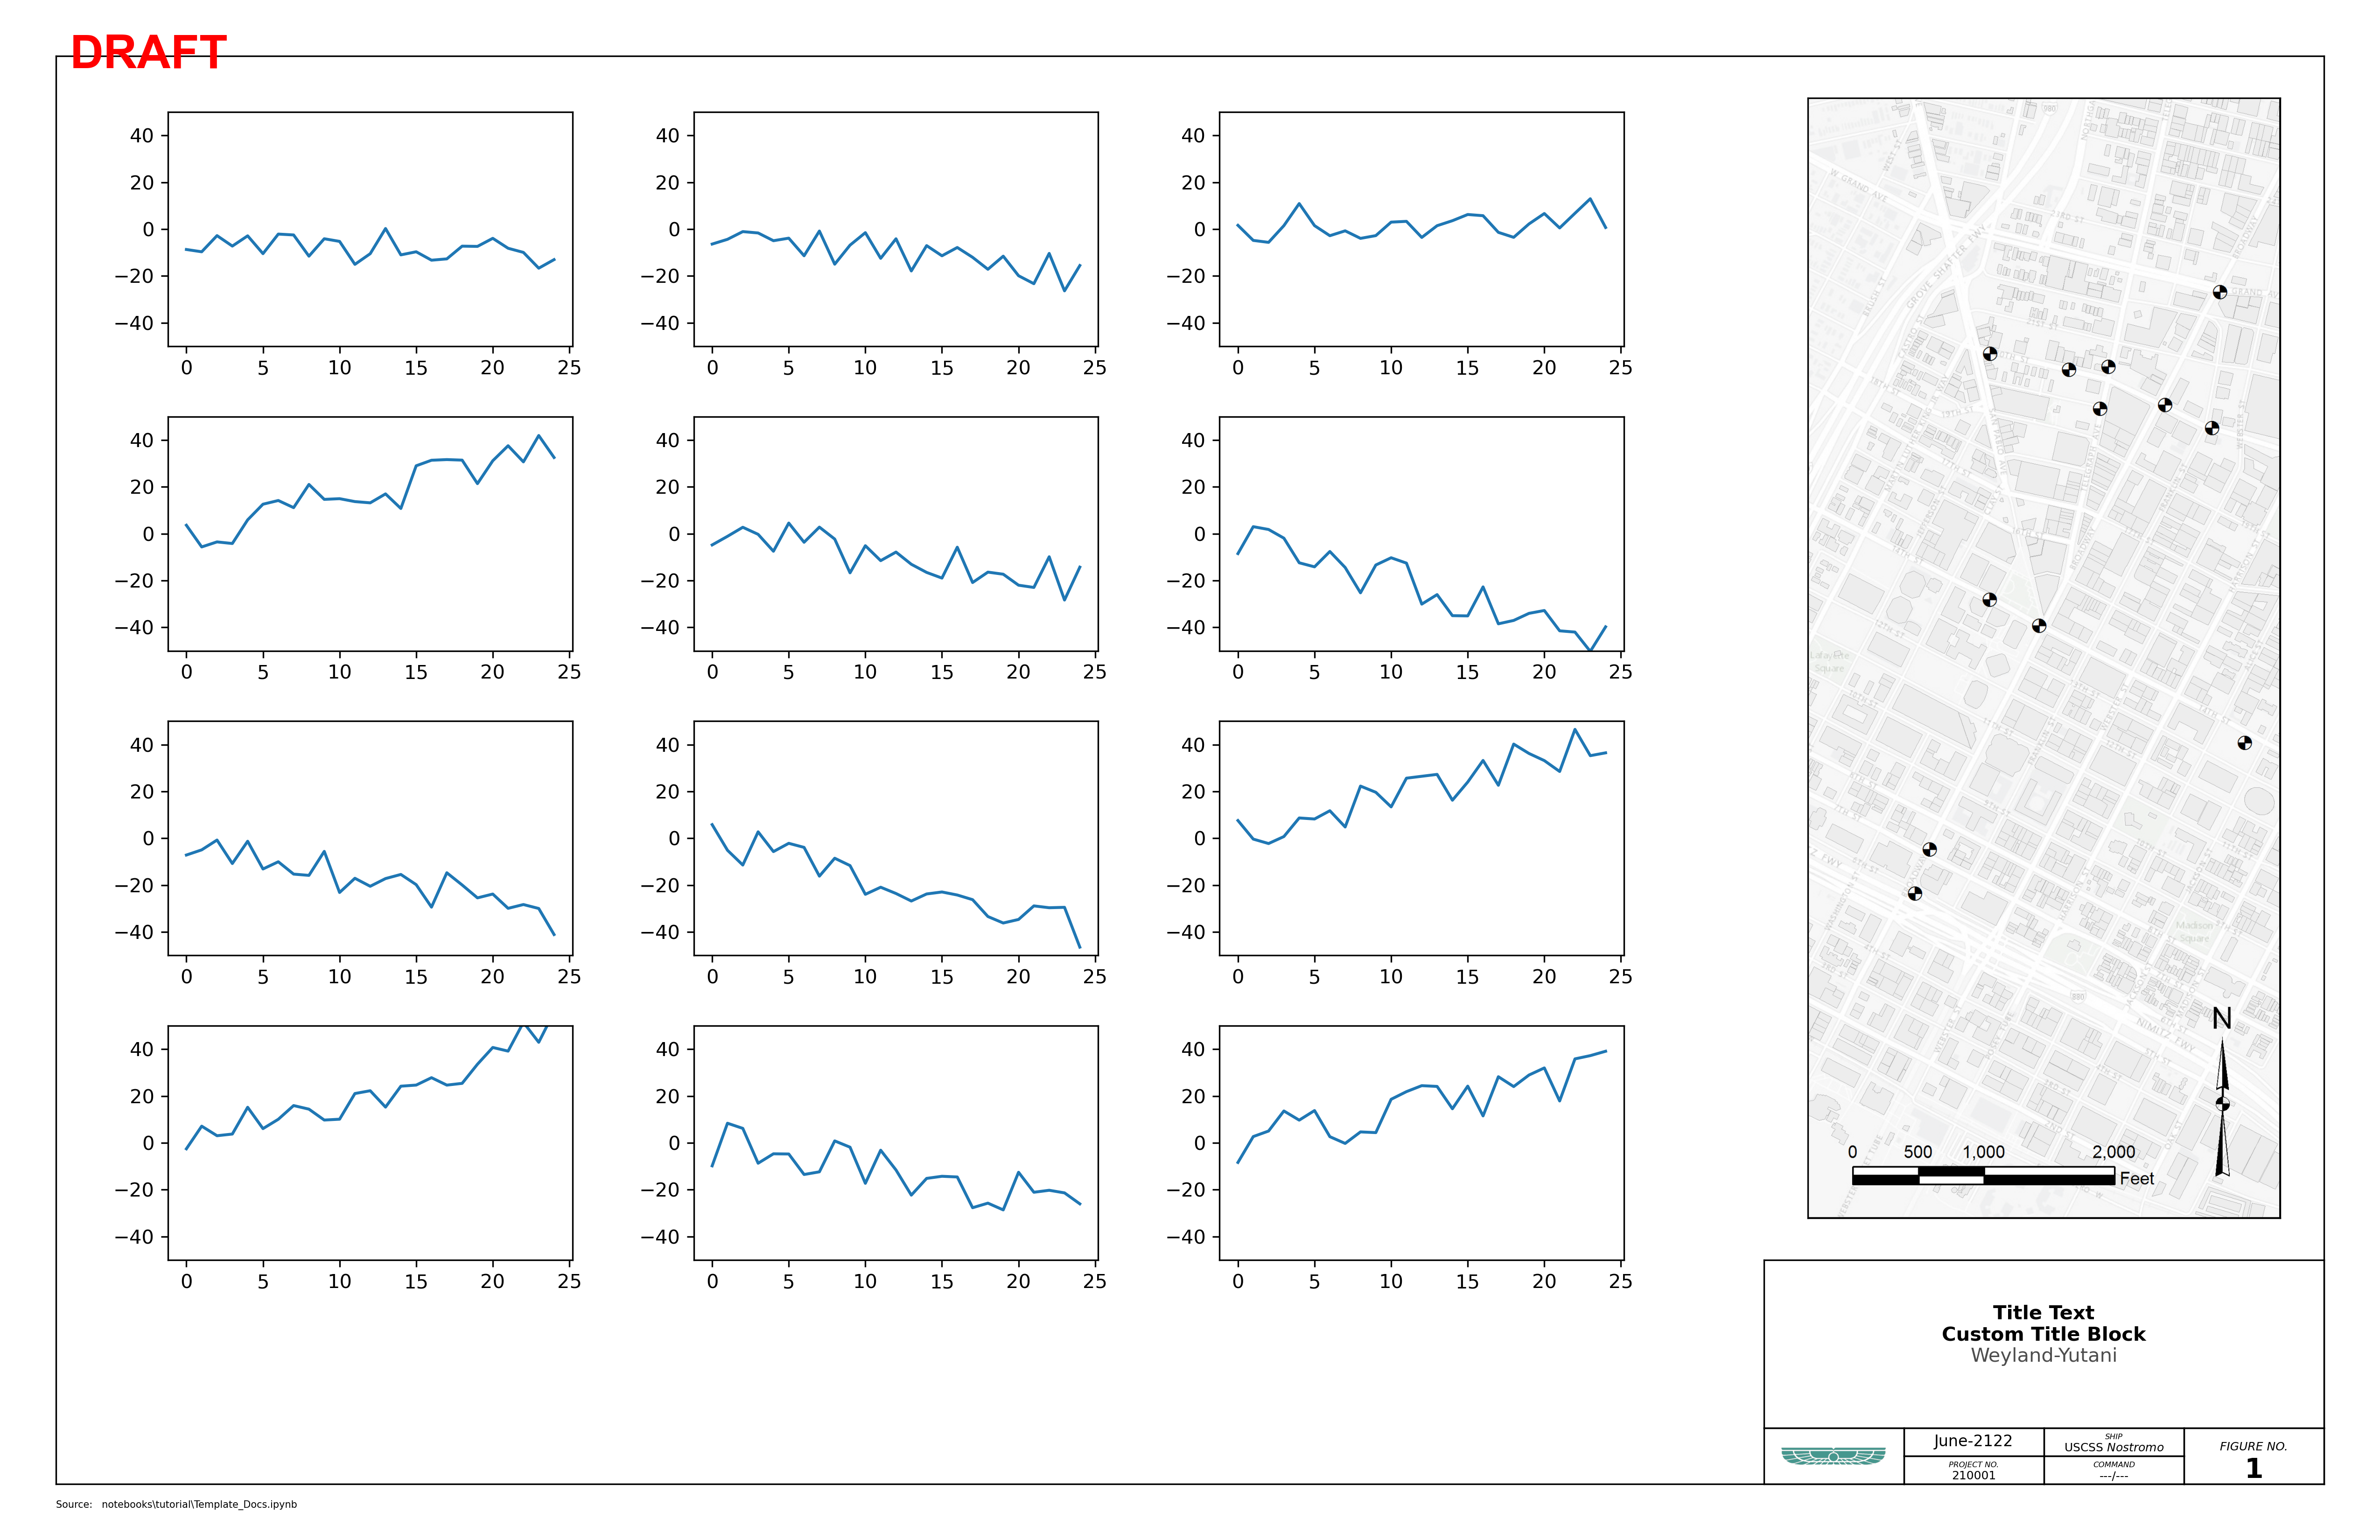
[19]:
fully_custom = [
    {
        "span": [0, 12, 0, 40],
        "name": "Title",
        "text": [
            {
                "ha": "center",
                "s": "Title Text\nCustom Title Block",
                "va": "baseline",
                "weight": "bold",
                "x": 0.5,
                "y": 0.52,
            },
            {
                "color": (0.3, 0.3, 0.3),
                "ha": "center",
                "s": "Weyland-Yutani",
                "va": "top",
                "weight": "light",
                "x": 0.5,
                "y": 0.48,
            },
        ],
    },
    {
        "name": "logo",
        "image": {
            "path": "img/logo.png",
            "scale": 0.75,
        },
        "span": [12, 16, 0, 10],
    },
    {
        "name": "date",
        "text": {
            "s": "June-2122",
            "fontsize": 8,
            "x": 0.5,
            "y": 0.5,
            "ha": "center",
            "va": "center",
        },
        "span": [12, 14, 10, 20],
    },
    {
        "name": "proj",
        "text": [
            {
                "ha": "center",
                "s": "PROJECT NO.",
                "va": "baseline",
                "fontsize": 4,
                "fontstyle": "italic",
                "x": 0.5,
                "y": 0.6,
            },
            {
                "ha": "center",
                "s": "210001",
                "va": "top",
                "fontsize": 6,
                "x": 0.5,
                "y": 0.48,
            },
        ],
        "span": [14, 16, 10, 20],
    },
    {
        "name": "ship",
        "text": [
            {
                "ha": "center",
                "s": "SHIP",
                "va": "baseline",
                "fontsize": 4,
                "fontstyle": "italic",
                "x": 0.5,
                "y": 0.6,
            },
            {
                "ha": "center",
                "s": "USCSS $Nostromo$",
                "va": "top",
                "fontsize": 6,
                "x": 0.5,
                "y": 0.48,
            },
        ],
        "span": [12, 14, 20, 30],
    },
    {
        "name": "review",
        "text": [
            {
                "ha": "center",
                "s": "COMMAND",
                "va": "baseline",
                "fontsize": 4,
                "fontstyle": "italic",
                "x": 0.5,
                "y": 0.6,
            },
            {
                "ha": "center",
                "s": "---/---",
                "va": "top",
                "fontsize": 6,
                "x": 0.5,
                "y": 0.48,
            },
        ],
        "span": [14, 16, 20, 30],
    },
    {
        "name": "fignum",
        "text": [
            {
                "ha": "center",
                "s": "FIGURE NO.",
                "va": "baseline",
                "fontsize": 6,
                "fontstyle": "italic",
                "x": 0.5,
                "y": 0.6,
            },
            {
                "ha": "center",
                "s": "1",
                "va": "top",
                "weight": "bold",
                "fontsize": 14,
                "x": 0.5,
                "y": 0.48,
            },
        ],
        "span": [12, 16, 30, 40],
    },
]


report_fig = Template(
    figsize=(17, 11),
    scriptname=SCRIPT,
    titleblock_content=fully_custom,
)
report_fig.path_text = PATH

_ = report_fig.add_frame()
tblk_axlist = report_fig.add_titleblock()
_ = report_fig.populate_titleblock()
_ = report_fig.add_path_text()

main = report_fig.gsfig[4 + top : -(report_fig.t_h + bottom), 8 + left : -(right + 50)]
gs_timeseries = gs.GridSpecFromSubplotSpec(4, 3, main, hspace=0.3, wspace=0.3)

for n in range(12):
    ax2 = report_fig.fig.add_subplot(gs_timeseries[n])
    x = np.arange(25)
    y = np.random.uniform(-2, 2) * x + np.random.uniform(-10, 10, x.shape)
    ax2.set_ylim((-50, 50))
    ax2.plot(x, y)

inset = report_fig.gsfig[
    3 + top : -(report_fig.t_h + bottom + 3),
    -(report_fig.t_w + right) : -right,
]

inset_ax = report_fig.fig.add_subplot(inset)
inset_ax.set_axis_off()

img = insert_image(inset_ax, "img/Template_Inset.png", scale=1)
Just for fun…
[20]:
fully_custom = [
    {
        "span": [0, 4, 0, 26],
        "text": {
            "s": "  Brand + Style",
            "ha": "left",
            "va": "center",
            "fontweight": "bold",
            "x": 0.0,
            "y": 0.5,
            "color": "white",
        },
    },
    {
        "span": [0, 4, 26, 77],
        "text": {
            "s": "  Weyland-Yutani",
            "ha": "left",
            "va": "center",
            "fontweight": "bold",
            "x": 0.0,
            "y": 0.5,
            "color": "white",
        },
    },
    {
        "span": [4, 16, 0, 63],
        "text": {
            "s": "BRAND GUIDELINES",
            "fontname": "Arial",
            "ha": "left",
            "va": "center",
            "fontsize": 32,
            "fontweight": "bold",
            "fontdict": {"stretch": "condensed"},
            "x": 0.01,
            "y": 0.5,
            "color": "white",
        },
    },
    {
        "span": [4, 16, 63, 77],
        "text": {
            "s": "06.21\n2122",
            "fontname": "Arial",
            "fontsize": 26,
            "fontweight": "bold",
            "fontdict": {"stretch": "condensed"},
            "ha": "center",
            "va": "center",
            "x": 0.5,
            "y": 0.5,
            "color": "white",
        },
    },
]


report_fig = Template(
    figsize=(8.5, 11),
    scriptname=SCRIPT,
    titleblock_rows=(4, 12),
    titleblock_cols=(34, 34, 9),
    titleblock_content=fully_custom,
    draft=False,
)
report_fig.path_text = ""
report_fig.fig.set_facecolor("#19302d")


left, right, top, bottom = report_fig.margins
report_fig.gstitleblock = report_fig.gsfig[
    -(bottom + report_fig.t_h) : -bottom,
    -(left + report_fig.t_w) : -left,
]

tblk_axlist = report_fig.add_titleblock()
_ = report_fig.populate_titleblock()

for ax in tblk_axlist:
    for spine in ax.spines.values():
        spine.set_edgecolor("white")
        spine.set_linewidth(1.5)

#  create a sub-gridspec that will be used for the main image
main = report_fig.gsfig[0 : -(report_fig.t_h + bottom * 2), :]

hero_ax = report_fig.fig.add_subplot(main)
hero_ax.set_axis_off()

hero_img_ax = insert_image(
    hero_ax,
    "img/alien_landscape.jpg",
    scale=1.1,
    expand=True,
    frameon=False,
)

#  create a sub-gridspec that will be used to overlay the logo
logo_gs = report_fig.gsfig[0:14, 58:80]

logo_ax = report_fig.fig.add_subplot(logo_gs)
logo_ax.set_axis_off()
logo_img_ax = insert_image(logo_ax, "img/logo.png", scale=1, frameon=False)